Top 10 Data Science Projects to Build in 2025 That Will Get You Hired

Are you ready to transform raw data into powerful insights and drive real-world innovation?
Data Science isn't just about crunching numbers; it's about solving complex, real-world problems with unparalleled innovation, crystal-clear insights, and measurable impact. In 2025, the demand for skilled data scientists who can deliver tangible results is higher than ever. Whether you're a student aspiring to break into this dynamic industry, a budding professional looking to upskill, or an experienced analyst aiming to stay ahead, these 10 cutting-edge data science projects are meticulously designed to help you stand out, dominate hackathons, and build an exceptional portfolio that speaks volumes about your capabilities.
In an era where data flows like an endless digital river, the true game-changers are those who possess the unique ability to transform raw information into actionable, strategic insights. Our curated list of projects pushes the boundaries of traditional analytics, seamlessly blending advanced Artificial Intelligence (AI) techniques, crucial ethical considerations, and real-time applications. These projects aren't just designed to teach you the fundamentals of data science; they are crafted to prepare you to lead in a future where data-driven decision-making shapes virtually every industry – from the intricate world of finance and life-saving healthcare to immersive entertainment and vital environmental sustainability efforts.
Ready to dive in? Build boldly, innovate fearlessly, and let your work become the blueprint for tomorrow’s groundbreaking innovations. This is your ultimate launchpad to mastering the craft of data science, driving significant impact, and claiming your indispensable space in the fast-evolving data science landscape. Elevate your skills, impress recruiters, and future-proof your career with these high-impact projects.
Here Are the Top 10 Data Science Projects for 2025 to Supercharge Your Portfolio:
Each project below is meticulously structured to maximize your learning, practical application, and overall impact. You'll find a clear, actionable framework to guide you through every step:
- Why It Wins (Project Value & Innovation): Understand the core business value, unique selling proposition, and innovative aspects that make this project a standout in the competitive data science arena. How does it address a critical need or offer a novel solution?
- Objective (Project Goal): A concise statement outlining the primary aim and expected outcomes of the project. What specific problem are you trying to solve?
- About the Project (Detailed Overview): A comprehensive description of the project, including its scope, the type of data involved, and the real-world context. This section provides a deeper understanding of the problem space and the project's relevance.
- Stack & Tools (Technologies & Frameworks): A list of essential programming languages (Python, R), libraries (Scikit-learn, TensorFlow, PyTorch, Pandas, NumPy), databases (SQL, NoSQL), cloud platforms (AWS, Azure, GCP), and visualization tools (Tableau, Power BI, Matplotlib, Seaborn) required to implement the project effectively.
- Algorithms & Techniques (Key Methods): Explore the core machine learning (ML) algorithms, deep learning (DL) architectures, statistical models, and data preprocessing techniques that power the solution. This could include regression, classification, clustering, NLP, computer vision, time series analysis, explainable AI (XAI), etc.
- How to Build (Step-by-Step Procedure): A detailed, actionable guide on how to develop and deploy the project. This covers data collection, cleaning, feature engineering, model training, evaluation, and deployment strategies.
- Use Cases & Impact (Real-World Relevance): Discover the practical applications and potential societal or business impact of the project. How can this solution be applied in different industries, and what measurable benefits does it offer?
Table of Contents: Your Roadmap to Data Science Mastery
1. Smart Loan Approval System Using Explainable AI (XAI)
2. Predictive Patient Risk Scoring System
3. Personalized Mental Health Chatbot using Sentiment-Driven NLP
4. Inventory Demand Forecasting for E-Commerce
5. Customer Segmentation Using RFM + Clustering
6. Real-Time Climate Impact Analyzer Using Satellite & IoT Data Fusion
7. Real Estate Price Prediction App
8. AI-Driven Script Success Predictor for OTT Platforms
9. AI Invoice Scanner & Fraud Detector
10. AI-Powered Chatbot for Student Counseling
1) 🧐 Smart Loan Approval System Using Explainable AI (XAI)
Overview: In an era where artificial intelligence increasingly influences critical financial decisions, the demand for transparency and accountability is paramount. This project addresses the inherent "black box" nature of traditional AI models by developing a Smart Loan Approval System integrated with Explainable AI (XAI). This system doesn't just provide a binary "approved" or "rejected" decision; it goes a crucial step further by explaining why a particular decision was made. This enhanced clarity is not just a technical improvement but a fundamental shift towards building more trustworthy and compliant AI applications, especially in highly regulated sectors like banking, finance, and insurance, where interpretability is a critical requirement, not merely a feature.
Why It Wins: This project stands out because it directly tackles one of the biggest challenges in AI adoption: trust. By incorporating XAI, it moves beyond simple predictive accuracy to offer insights into the decision-making process, making AI systems more reliable and auditable. This is especially vital for regulated industries like banking and insurance, where understanding the rationale behind loan approvals or insurance underwriting decisions is not just a "nice-to-have" but a legal and ethical imperative. It empowers both lenders and borrowers with unprecedented transparency.
Objective: The primary objective is to develop a transparent and robust AI model capable of accurately predicting loan approvals while simultaneously providing clear, understandable explanations for each decision. This dual focus aims to significantly increase fairness, mitigate algorithmic bias, and ensure strict adherence to regulatory compliance standards such as those mandated by the Reserve Bank of India (RBI), GDPR, or fair lending acts.
About the Project: This project directly confronts the "black-box problem" prevalent in many machine learning models used for credit scoring and loan risk assessment. By integrating advanced Explainable AI (XAI) methods, specifically focusing on techniques like SHAP (SHapley Additive exPlanations), the system is designed to reveal the underlying factors contributing to a loan approval or rejection. SHAP values allow us to quantify the impact of each input feature (e.g., credit score, income, debt-to-income ratio, employment history) on the final loan decision, both at a global model level and for individual loan applications. This deep level of interpretability enables financial institutions to not only make more informed decisions but also to articulate these decisions clearly to applicants, identify and rectify potential biases in their data or models, and demonstrate compliance to regulatory bodies. The project culminates in a user-friendly interface that visualizes these explanations, making complex AI decisions accessible to human understanding.
Stack & Tools: Python, SHAP, Scikit-learn, Streamlit Algorithms & Techniques: Logistic Regression, Decision Trees, SHAP interpretability framework
How to Build:
- Gather anonymized loan datasets (e.g., from Kaggle, UCI Machine Learning Repository).
- Preprocess data — clean, handle missing values, normalize/scale features, encode categorical variables, and address class imbalance (if any) using techniques like SMOTE.
- Train classification models (e.g., Logistic Regression, Decision Trees, potentially ensemble methods like Random Forest or Gradient Boosting) to predict loan status (approved/rejected).
- Evaluate model performance using metrics like accuracy, precision, recall, F1-score, and ROC-AUC.
- Apply SHAP (SHapley Additive exPlanations) to generate local (instance-level) and global (model-level) explanations for the trained models.
- Create a user-friendly Streamlit web application. This app will allow users to input loan application details, receive a predicted approval status, and visualize the SHAP explanations showing which features contributed positively or negatively to the decision and by how much.
- Thoroughly test the system with diverse real or simulated loan applications to validate its accuracy, interpretability, and robustness.
- Iteratively refine the model and explanations based on feedback and performance analysis.
Use Cases & Impact: Banks, credit unions, non-banking financial companies (NBFCs), and fintech companies can significantly benefit from this system. It allows them to:
- Improve Transparency: Clearly explain loan decisions to applicants and internal stakeholders.
- Reduce Bias: Identify and mitigate discriminatory patterns in lending practices by understanding feature contributions.
- Ensure Regulatory Compliance: Meet stringent requirements from bodies like RBI or comply with regulations such as GDPR (Right to Explanation) and fair lending laws.
- Boost Customer Trust: Foster a more transparent and fair lending environment, enhancing customer loyalty and satisfaction.
- Streamline Auditing: Provide clear audit trails for every loan decision, simplifying internal and external audits.
- Enhance Risk Management: Better understand the risk factors influencing loan defaults based on interpretable insights.
Project 1: Smart Loan Approval System Using Explainable AI (XAI) Codes:
🔗 View Project Code on GitHub🧩 Conclusion
In an era where AI must be more than just accurate—it must be accountable—this Smart Loan Approval System powered by Explainable AI represents a paradigm shift. It doesn’t just predict; it justifies. By merging predictive performance with human-readable transparency, this project addresses the rising demand for ethical AI, regulatory alignment, and fair decision-making in finance.
For data scientists, this isn’t just a project — it’s a portfolio flagship that proves your ability to build systems that meet real-world complexity with clarity. For institutions, it’s a leap toward trustworthy, bias-aware automation that aligns with tomorrow’s compliance-first ecosystem.
🛡️ In the race toward intelligent, responsible lending, this project ensures you’re not just building models—you’re building confidence, credibility, and compliance into every decision made.
2) 🏥 Predictive Patient Risk Scoring System
Overview: In modern healthcare, proactive intervention is key to improving patient outcomes and optimizing resource allocation. This project focuses on developing a sophisticated Predictive Patient Risk Scoring System that leverages machine learning to identify individuals at high risk of future hospitalization or adverse health events. By analyzing a comprehensive set of patient data, this system provides medical practitioners with an early warning mechanism, enabling timely and targeted interventions. This proactive approach is critical not only for potentially saving lives by addressing deteriorating conditions before they become critical but also for enhancing the efficiency of healthcare operations, reducing the burden on emergency services, and optimizing the utilization of valuable medical resources.
Why It Wins: This system is a game-changer for healthcare providers because it enables early intervention, shifting from reactive treatment to proactive care. By accurately predicting hospitalization risk, it empowers clinicians to prioritize care for vulnerable patients, leading to reduced emergency admissions, shorter hospital stays, and ultimately, improved patient health and cost savings for healthcare systems. It's a crucial tool for optimizing hospital bed management and staff allocation in a dynamic environment.
Objective: The primary objective is to develop a highly accurate and interpretable predictive model, complemented by an intuitive dashboard, that assists medical practitioners in identifying patients at significant risk of hospitalization or requiring intensive care. This system aims to support clinical decision-making by providing actionable insights derived from patient data, thereby facilitating timely medical interventions and personalized care plans.
About the Project: This project involves building a robust machine learning pipeline that consumes and analyzes diverse patient data streams. It utilizes historical health records (e.g., diagnoses, medications, past procedures), real-time vitals (e.g., heart rate, blood pressure, temperature, oxygen saturation), and potentially lifestyle data (e.g., activity levels, dietary information, if available) to calculate dynamic, real-time patient risk scores. A key innovative aspect of this project is the integration of time-series anomaly detection techniques. This allows the system to continuously monitor changes in a patient's physiological parameters and detect subtle deviations or worsening trends that might indicate a deteriorating condition, even before overt symptoms appear. The predictive models (such as Logistic Regression or Random Forests) will be trained to learn complex patterns associated with hospitalization events. The output will be integrated into an interactive dashboard, providing clinicians with a clear visualization of risk scores, key contributing factors for each patient, and temporal trends in their health status. This holistic approach ensures that medical professionals have a comprehensive view to make informed and timely decisions regarding patient care.
Stack & Tools: Pandas, Scikit-learn, XGBoost, Plotly Dash Algorithms & Techniques: Logistic Regression, Random Forests, XGBoost, Time-series anomaly detection (e.g., ARIMA, Isolation Forest, or statistical process control methods adapted for time series)
How to Build:
- Data Collection & Simulation: Acquire or simulate comprehensive patient datasets. This should include structured data like demographics, medical history (diagnoses, medications, lab results), and vitals over time. Considerations for real-world application would include data from Electronic Health Records (EHRs) or IoT devices.
- Data Cleaning & Preprocessing: Perform extensive data cleaning, handle missing values, normalize/scale numerical features, encode categorical variables, and engineer new features where relevant (e.g., calculating Body Mass Index from height and weight, or duration of illness).
- Feature Engineering for Time Series: Extract relevant features from time-series data, such as moving averages, standard deviations, trends, and periodicity for vital signs.
- Model Training for Risk Prediction: Train various classification models (e.g., Logistic Regression, Random Forests, Gradient Boosting Machines like XGBoost) to predict the likelihood of hospitalization within a defined future window (e.g., next 7, 30, or 90 days).
- Time-Series Anomaly Detection Integration: Develop and integrate models for detecting anomalies or significant deviations in vital signs or other time-series health indicators. This could involve statistical methods, machine learning models, or deep learning approaches.
- Dashboard Development: Create an interactive, user-friendly dashboard using Plotly Dash. This dashboard will display patient risk scores, visualize trends in vitals, highlight contributing factors to risk, and potentially offer drill-down capabilities for individual patient profiles.
- Model Validation & Refinement: Validate the predictive performance of the models using robust metrics like accuracy, precision, recall, F1-score, ROC-AUC. Critically, validate with retrospective patient outcomes to ensure the model's predictions align with actual hospitalization events. Iteratively refine models based on performance and clinical feedback.
Use Cases & Impact:
- Hospital Operations: Hospitals can proactively identify patients at risk of readmission or initial admission, optimizing bed allocation, staff scheduling, and resource planning.
- Triage and Prioritization: Emergency departments and outpatient clinics can use risk scores to prioritize patients who require immediate attention.
- Chronic Disease Management: Help healthcare providers monitor patients with chronic conditions, identifying early signs of deterioration to prevent acute exacerbations.
- Telemedicine and Remote Monitoring: Integrate with remote patient monitoring systems to alert clinicians when an at-home patient's vital signs indicate increasing risk.
- Population Health Management: Identify high-risk patient cohorts for targeted preventive care programs and interventions, leading to better overall community health.
Project 2: Predictive Patient Risk Scoring System Codes:
🔗 View Project Code on GitHub🧬 Conclusion
In a healthcare ecosystem shifting rapidly from treatment to prevention, this Predictive Patient Risk Scoring System stands as a sentinel of the future. It’s more than a machine learning project—it’s a life-saving, system-optimizing, decision-empowering engine.
By translating raw patient data into actionable foresight, it equips healthcare providers with the tools to intervene before emergencies unfold. From ICU risk alerts to chronic care insights, this system brings proactive intelligence to the heart of clinical operations.
It doesn’t just predict hospitalization—it rewires the clinical response paradigm. It reduces guesswork, boosts resource allocation efficiency, and ultimately drives better patient outcomes at lower costs.
This isn’t just innovation—it’s precision medicine in action. Built on interpretable models, real-time signals, and intuitive dashboards, this project proves that the intersection of AI and healthcare isn’t just theoretical—it’s operational, ethical, and essential.
📊 For practitioners, it’s clarity.
🚑 For patients, it’s safety.
💡 For you, it’s a powerful case study in how data saves lives.
3)💬 Personalized Mental Health Chatbot using Sentiment-Driven NLP
Overview: In an increasingly digital world, access to mental health support remains a significant challenge due to stigma, cost, and limited availability of human therapists. This project aims to bridge that gap by developing a Personalized Mental Health Chatbot powered by advanced Natural Language Processing (NLP) and sentiment analysis. This intelligent conversational agent is designed to provide immediate, scalable, and empathetic support to users by understanding their emotional state and tailoring responses accordingly. Unlike generic chatbots, this system focuses on creating a truly personalized experience, making it a vital tool for preliminary support, mood tracking, and guiding users towards appropriate resources, thereby democratizing access to crucial mental wellness services.
Why It Wins: This project addresses a critical societal need: scalable and accessible mental health support. By integrating sentiment analysis, the chatbot can move beyond keyword recognition to genuinely understand the user's emotional state, leading to more empathetic and relevant interactions. It offers a private, non-judgmental space for users to express themselves, making it an invaluable first line of defense for mental wellness, especially in situations where professional help is not immediately available or for those hesitant to seek it. Its ability to provide continuous mood tracking and timely interventions makes it a powerful tool for proactive mental health management.
Objective: The core objective is to create a highly empathetic and effective conversational AI that can understand and interpret user sentiment, track changes in mood over time, and offer personalized mental health support. This includes providing relevant coping strategies, guided exercises (like mindfulness or breathing techniques), psychoeducational content, and, crucially, making appropriate referrals to human professionals or crisis hotlines when necessary, all within a confidential and supportive digital environment.
About the Project: This project focuses on building a sophisticated chatbot that excels in empathetic human-computer interaction, primarily through the intelligent integration of sentiment analysis and advanced Natural Language Processing (NLP). The system will leverage sentiment analysis pipelines (e.g., using NLTK or TextBlob) to accurately discern the emotional tone and underlying sentiment of user inputs – whether it's positive, negative, neutral, or specific emotions like sadness, anxiety, or frustration. This sentiment-driven approach allows the chatbot to respond with greater sensitivity and relevance. Beyond sentiment, the NLP component will be responsible for intent classification, understanding the user's underlying goal (e.g., "I need to relax," "I'm feeling down," "I want to track my mood"), and named entity recognition to extract key information.
The conversational flow will be managed by frameworks like Rasa, which handles dialogue management, ensuring coherent and context-aware interactions. For generating highly natural and nuanced responses, the project will integrate Large Language Models (LLMs) such as those from GPT APIs. These models can synthesize human-like text, enabling the chatbot to provide personalized advice, supportive statements, and relevant information dynamically. A critical feature will be the ability to log mood changes and conversation history, storing this valuable, anonymized data in a flexible NoSQL database like MongoDB. This historical data can then be used to personalize future interactions, identify deteriorating mood patterns, and potentially trigger timely interventions or recommend seeking professional help based on predefined thresholds or detected distress signals. The project aims to provide a continuous, evolving support system that learns and adapts to the individual user's needs over time.
Stack & Tools: NLTK, TextBlob, Rasa, GPT APIs (or other LLMs like Google's Gemini API), MongoDB, Python Algorithms & Techniques: Sentiment analysis (Lexicon-based, Machine Learning-based), Intent Classification (e.g., SVMs, Deep Learning-based classifiers), Named Entity Recognition, Dialogue Management (state-based or policy-based), Sequence-to-Sequence models for dialogue generation (leveraging pre-trained LLMs).
How to Build:
- Data Collection & Annotation: Gather or create a dataset of conversational exchanges related to mental health. Annotate this data for sentiment, user intent, and relevant entities to train custom NLP models.
- Sentiment Analysis Pipeline Development: Implement robust sentiment analysis using libraries like TextBlob or NLTK's VADER for initial sentiment detection. Consider training custom sentiment models using machine learning if generic ones prove insufficient for mental health context.
- Intent Classification & Entity Recognition: Train models (e.g., using Rasa NLU) to accurately classify user intents (e.g., "express emotion," "seek coping strategy," "ask for information") and extract relevant entities (e.g., specific emotions, triggers).
- Dialogue Management with Rasa: Design the conversational flows and dialogue policies using Rasa. Define stories and rules to guide the chatbot's responses based on user input, intent, and sentiment.
- Integrate LLMs for Natural Conversation: Connect with GPT APIs (or other suitable LLMs) to generate more diverse, empathetic, and contextually appropriate responses, especially for open-ended queries or complex emotional expressions. Use careful prompt engineering to guide LLM behavior.
- Mood Tracking & Personalization: Implement logic to track user mood over time based on sentiment analysis of their input. Store this data in MongoDB along with conversation logs to enable personalization and identification of trends.
- Intervention and Referral Logic: Develop rules or models to identify critical situations (e.g., expressions of severe distress, suicidal ideation) that warrant immediate referral to crisis hotlines or mental health professionals.
- Deployment: Deploy the chatbot on a suitable platform such as a web interface (using Flask/Django for backend, HTML/CSS/JS for frontend) or integrate it with popular messaging platforms (e.g., WhatsApp, Telegram) for broader accessibility.
- Testing & Iteration: Conduct extensive testing with diverse user inputs. Gather feedback and continuously iterate on the NLP models, dialogue flows, and response generation to improve empathy, accuracy, and overall user experience.
Use Cases & Impact:
- Workplaces: Provide employees with confidential, on-demand mental wellness support, reducing stress and improving productivity.
- Educational Institutions: Offer students a safe space to discuss anxieties and receive support, especially during stressful periods.
- Telehealth Platforms: Serve as a preliminary screening tool, provide post-therapy support, or bridge gaps between therapy sessions.
- Self-Help & Wellness Apps: Enhance existing wellness applications with conversational, personalized mental health coaching features.
- Crisis Intervention (as a first filter): Act as a preliminary contact point, quickly identifying high-risk users and directing them to immediate human intervention.
Project 3: Personalized Mental Health Chatbot using Sentiment-Driven NLP Codes:
🔗 View Project Code on GitHub🧠 Conclusion
In a world echoing with digital noise and silent suffering, this Personalized Mental Health Chatbot emerges as more than just tech—it’s a digital confidant, a 24/7 empathetic presence when human help feels distant or inaccessible. Built at the intersection of emotional intelligence and artificial intelligence, this system redefines what support means in the age of automation.
By combining the analytical precision of NLP and sentiment analysis with the human-like depth of large language models, it doesn’t just process words—it understands pain, patterns, and progress. It listens, learns, and evolves, offering a dynamic mental wellness experience tailored to each user's emotional landscape.
But its impact goes beyond the screen. From easing the burden on mental health professionals to democratizing access for marginalized communities, this chatbot is a silent revolution—scaling compassion, destigmatizing vulnerability, and creating a safe space in every smartphone.
💬 For users, it’s a safe voice when they need one.
🔍 For systems, it’s a scalable bridge to care.
🚀 For the world, it’s a forward step in healing with code.
This isn’t just a project. It’s a promise—that no one has to feel alone, ever again.

🚀 Ready to turn your passion for data into real-world intelligence?
At Huebits, we don’t just teach Data Science — we train you to solve real problems with real data, using industry-grade tools that top tech teams trust.
From messy datasets to powerful machine learning models, you’ll gain hands-on experience building end-to-end AI systems that analyze, predict, and deliver impact.
🧠 Whether you’re a student, aspiring data scientist, or future AI architect, our Industry-Ready Data Science, AI & ML Program is your launchpad. Master Python, Pandas, Scikit-learn, Power BI, model deployment with Flask, and more — all by working on real-world projects that demand critical thinking and execution.
🎓 Next Cohort Starts Soon!
🔗 Join Now and secure your place in the AI revolution shaping tomorrow’s ₹1 trillion+ data-driven economy.
4) 📦 Inventory Demand Forecasting for E-Commerce
Overview: In the fast-paced and competitive e-commerce landscape, efficient inventory management is a critical determinant of profitability and customer satisfaction. This project addresses a fundamental challenge faced by online businesses: accurately predicting future product demand. By developing a sophisticated Inventory Demand Forecasting System, we aim to empower e-commerce companies to make data-driven decisions regarding their stock levels. This system leverages advanced time-series analysis and machine learning to anticipate SKU-level demand, thereby optimizing inventory costs, minimizing losses due to obsolescence or expiry, and crucially, preventing stockouts that lead to lost sales and dissatisfied customers. It's about finding the perfect balance between having enough stock to meet demand and not holding excessive inventory that ties up capital.
Why It Wins: This project offers a direct and significant impact on an e-commerce business's bottom line. By providing highly accurate demand forecasts, it enables companies to optimize their inventory levels, striking a crucial balance between avoiding costly overstocking (which incurs storage costs, risk of obsolescence, and tied-up capital) and preventing frustrating stockouts (which lead to lost sales, customer dissatisfaction, and potential loss of loyal customers). This translates directly into reduced operational waste, improved cash flow, enhanced supply chain efficiency, and ultimately, higher customer satisfaction due to consistent product availability.
Objective: The primary objective is to develop a robust and accurate predictive model capable of forecasting demand at the individual Stock Keeping Unit (SKU) level. This system will assist e-commerce businesses in making informed decisions about purchasing, production, and distribution, with the ultimate goal of minimizing both overstock situations (excess inventory holding costs) and stockouts (lost sales opportunities and customer dissatisfaction).
About the Project: This project involves building a powerful time-series forecasting engine that processes and learns from vast amounts of historical sales data. The core of the system relies on analyzing patterns within this historical data, including seasonality (e.g., holiday sales surges, monthly trends), trends (e.g., product lifecycle growth or decline), and exogenous factors (e.g., promotions, marketing campaigns, economic indicators, or even weather, if relevant to the product). The project will utilize state-of-the-art time-series forecasting models such as Facebook Prophet, which is excellent for handling seasonality and holidays, and potentially deep learning models like Long Short-Term Memory (LSTM) networks (from TensorFlow/Keras) for capturing complex temporal dependencies and non-linear patterns in sales data.
Beyond just prediction, the project emphasizes actionable insights. The forecasted demand will be integrated with interactive dashboards (e.g., developed using Power BI or custom web dashboards using Flask and a charting library) to provide business users with clear, intuitive visualizations of future demand trends. These dashboards will allow inventory managers, supply chain professionals, and sales teams to easily understand forecasted quantities, identify potential risks or opportunities, and plan their purchasing and logistical operations accordingly. The system will also consider metrics like forecast accuracy (e.g., Mean Absolute Error, Root Mean Squared Error) to continuously evaluate and refine the models, ensuring their continued effectiveness in a dynamic market environment. The final solution will be designed to be scalable and integrable into existing e-commerce platforms via RESTful APIs.
Stack & Tools: Python, Pandas, NumPy, Facebook Prophet, TensorFlow/Keras, Flask, Power BI (or alternative visualization tools like Matplotlib, Plotly) Algorithms & Techniques: Time-series forecasting (ARIMA, SARIMA, Exponential Smoothing, Facebook Prophet), Deep Learning (Long Short-Term Memory - LSTM networks, Recurrent Neural Networks - RNNs), Regression Analysis (for incorporating exogenous variables), Cross-validation for time series data.
How to Build:
- Data Collection & Preparation: Gather comprehensive historical sales data per SKU. This includes transaction dates, product IDs, quantities sold, and potentially other relevant data like pricing, promotional flags, marketing spend, and external factors (e.g., holidays, competitor activities). Clean the data by handling missing values, outliers, and ensuring consistent time series granularity.
- Exploratory Data Analysis (EDA): Analyze sales patterns, identify trends, seasonality (daily, weekly, monthly, yearly), and the impact of promotions or special events. This step is crucial for feature engineering and model selection.
- Feature Engineering: Create features from the raw time series data, such as lagged sales, rolling averages, day of week, month, quarter, year, and indicators for holidays or marketing campaigns.
- Model Training & Selection:
- Prophet: Train Facebook Prophet models for each SKU or groups of SKUs, leveraging its strength in handling seasonality and holidays.
- LSTM Networks: For more complex patterns or large datasets, design and train LSTM networks using TensorFlow/Keras, especially effective for capturing long-term dependencies.
- Regression Models: Consider using regression analysis to incorporate the impact of external variables (e.g., marketing budget, website traffic) on demand.
- Model Evaluation: Evaluate the accuracy of forecasting models using appropriate metrics like Mean Absolute Error (MAE), Root Mean Squared Error (RMSE), Mean Absolute Percentage Error (MAPE), and Weighted Average Percentage Error (WAPE). Implement time-series specific validation strategies (e.g., walk-forward validation).
- Visualization & Dashboarding: Develop interactive dashboards using Power BI (or custom web dashboards with Plotly/Matplotlib and Flask) to visualize historical sales, demand forecasts, forecast confidence intervals, and key performance indicators related to inventory.
- API Development: Develop RESTful API endpoints using Flask to expose the forecasting models, allowing seamless integration with existing e-commerce platforms, Enterprise Resource Planning (ERP) systems, or inventory management software.
- Deployment & Monitoring: Deploy the forecasting system (e.g., on cloud platforms like AWS, GCP, Azure). Implement monitoring tools to track model performance in real-time, detect concept drift, and trigger retraining when necessary.
- Iterative Refinement: Continuously collect new data, retrain models, and refine algorithms based on ongoing performance, business feedback, and changing market conditions.
Use Cases & Impact:
- Retailers & D2C Brands: Optimize purchasing decisions, reduce carrying costs, improve stock rotation, and minimize lost sales due to stockouts.
- Supply Chain Management: Enhance planning for logistics, warehousing, and transportation, leading to a more agile and responsive supply chain.
- Manufacturing: Improve production scheduling and raw material procurement, reducing waste and lead times.
- Marketing & Promotions: Inform promotional strategies by understanding the demand elasticity of different products and predicting their impact.
- Financial Planning: Provide more accurate revenue forecasts and improve budgeting accuracy by aligning with anticipated sales volumes.
Project 4: Inventory Demand Forecasting for E-Commerce Codes:
🔗 View Project Code on GitHub📦 Conclusion
In the cutthroat arena of e-commerce, where customer expectations are sky-high and margins razor-thin, the difference between thriving and just surviving lies in foresight. This Inventory Demand Forecasting System is not just a backend tool—it’s a strategic compass that empowers businesses to predict demand with surgical precision and act before the market even blinks.
By fusing statistical time-series models with deep learning architectures, this system doesn’t just analyze the past—it anticipates the future. It decodes seasonality, responds to real-world variables, and adapts dynamically to trends—turning historical sales chaos into calm, actionable clarity. From preventing the pain of stockouts to eliminating deadstock drag, it ensures that inventory is always aligned with reality.
But the true win? It gives businesses control—over capital, customer experience, and cash flow. With crystal-clear dashboards and seamless integrations, it becomes the invisible intelligence driving supply chain precision and sales success.
🔍 See clearer. Plan smarter. React faster.
💡 This isn’t forecasting. This is future-proofing.
📈 And in the world of e-commerce, it’s not just helpful—it’s mission critical.
5) 🛒 Customer Segmentation Using RFM + Clustering
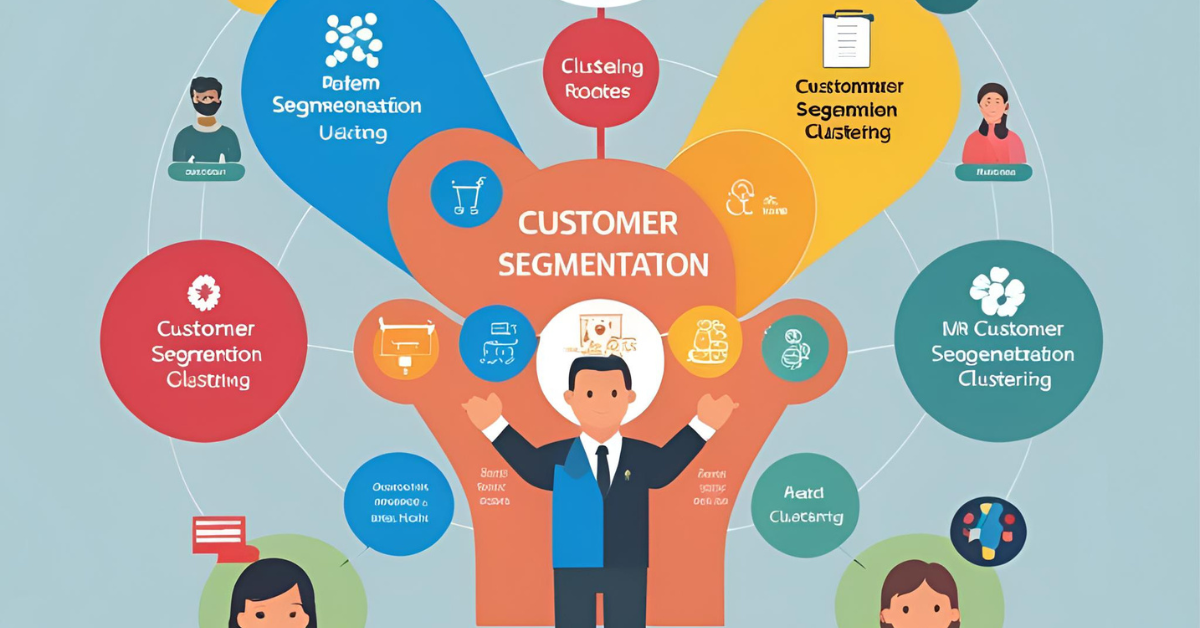
Overview: In today's competitive market, understanding your customers is paramount for business success. A one-size-fits-all marketing approach is often inefficient and yields suboptimal results. This project tackles this challenge by developing a robust Customer Segmentation System that leverages a powerful combination of RFM (Recency, Frequency, Monetary) analysis and advanced clustering algorithms. The goal is to move beyond superficial demographics to identify distinct customer groups based on their actual buying behavior. This precise segmentation enables businesses to craft highly targeted marketing campaigns, develop personalized product recommendations, and implement effective customer retention strategies, ultimately maximizing marketing ROI and fostering stronger customer relationships.
Why It Wins: This project provides a powerful competitive advantage by enabling precision marketing. Instead of broad, generic campaigns, businesses can identify specific customer groups based on their past purchasing behavior and tailor messaging, offers, and retention efforts to resonate deeply with each segment. This leads to significantly higher engagement rates, increased conversion rates, improved customer lifetime value, and reduced marketing waste, making every marketing dollar work harder.
Objective: The primary objective is to segment a customer base into meaningful, actionable groups by analyzing their purchasing behavior through RFM metrics and applying unsupervised machine learning (clustering). This segmentation will empower businesses to develop highly targeted marketing campaigns, optimize customer relationship management (CRM) strategies, and implement effective customer retention programs that resonate with the unique characteristics of each customer group.
About the Project: This project dives deep into a customer's purchasing history to uncover valuable insights. It begins with the calculation of Recency, Frequency, and Monetary (RFM) metrics for each customer:
- Recency: How recently did the customer make a purchase? (e.g., days since last purchase). Customers who bought recently are generally more engaged.
- Frequency: How often does the customer make purchases? (e.g., total number of purchases or transactions). More frequent buyers are often more loyal.
- Monetary: How much money does the customer spend? (e.g., total revenue generated by the customer). Higher spending customers are often more valuable.
Once these three core metrics are computed, they form the basis for our customer profiling. The project then employs clustering algorithms such as K-Means or DBSCAN to automatically identify natural groupings within the customer data based on their RFM scores. K-Means is effective for finding spherical clusters and is widely used, while DBSCAN can discover arbitrarily shaped clusters and handle noise. Before clustering, the RFM metrics will be appropriately scaled or transformed to ensure that no single metric disproportionately influences the clustering results. The resulting clusters will represent distinct customer segments (e.g., "Loyal High-Value Customers," "New Engaged Customers," "At-Risk Customers," "Churned Customers"). Each segment will have unique characteristics, behavioral patterns, and value to the business. The project culminates in visualizing these clusters and their defining characteristics, often through interactive dashboards (Tableau, Power BI) or static plots (Seaborn, Matplotlib), making the insights easily digestible for marketing and sales teams. This visual representation helps stakeholders understand the "why" behind each segment and allows for the development of tailored strategies.
Stack & Tools: Python (Pandas for data manipulation, Seaborn/Matplotlib for visualization), Scikit-learn (for clustering algorithms), Tableau (for advanced dashboarding and interactive visualization). Algorithms & Techniques: RFM analysis, K-Means Clustering, DBSCAN Clustering, Hierarchical Clustering (optional), Principal Component Analysis (PCA) for dimensionality reduction (optional, for visualization or improving clustering), Descriptive Statistics, Data Visualization.
How to Build:
- Data Collection & Preparation: Obtain transactional sales data for customers, including customer ID, order date, and order total. Clean the data by handling duplicates, missing values, and ensuring data consistency.
- Calculate RFM Metrics: For each unique customer, calculate:
- Recency: Days since their last purchase from a reference date (e.g., today's date or the last transaction date in the dataset).
- Frequency: Total number of distinct purchases made by the customer.
- Monetary: Sum of all money spent by the customer.
- RFM Scoring (Optional but Recommended): Assign scores (e.g., 1-5) to Recency, Frequency, and Monetary values, often by ranking them into quintiles. This can help in defining segments directly or as input to clustering.
- Normalize and Prepare Data for Clustering: Standardize or normalize the RFM values (e.g., using StandardScaler or MinMaxScaler from Scikit-learn) to ensure that each metric contributes equally to the clustering process, preventing metrics with larger scales from dominating.
- Determine Optimal Number of Clusters (for K-Means): Use methods like the Elbow Method or Silhouette Score to identify the optimal number of clusters (k) for the K-Means algorithm.
- Run Clustering Algorithms:
- K-Means: Apply the K-Means algorithm to the normalized RFM data.
- DBSCAN: Optionally, use DBSCAN to identify clusters based on density, which can handle irregularly shaped clusters and identify noise.
- Profile and Interpret Clusters: Analyze the characteristics of each identified cluster based on their average RFM scores, demographics (if available), and product preferences. Assign meaningful names to each segment (e.g., "Champions," "Loyal Customers," "New Customers," "At-Risk," "Lost Customers").
- Visualize Clusters: Create compelling visualizations using Seaborn, Matplotlib, or Tableau. Examples include scatter plots of RFM dimensions, bar charts showing average RFM values per segment, and heatmaps.
- Develop Segment-Specific Marketing Strategies: Based on the insights from each segment, formulate tailored marketing and communication strategies.
- High-Value/Loyal: Reward programs, exclusive offers, personalized upsell/cross-sell.
- New Customers: Onboarding campaigns, product education, encouragement for repeat purchases.
- At-Risk/Churned: Re-engagement campaigns, win-back offers, personalized discounts.
- Test and Refine: Implement the strategies and monitor their impact. Continuously refine the segmentation model and strategies based on campaign performance and evolving customer behavior.
Use Cases & Impact:
- Marketing & Sales Teams: Design highly effective and personalized email campaigns, push notifications, advertisements, and promotional offers.
- Customer Relationship Management (CRM): Improve customer service by understanding segment-specific needs and tailoring support interactions.
- Product Development: Inform product roadmaps by identifying which features or products appeal to specific customer segments.
- Pricing Strategy: Develop tiered pricing or discount strategies based on the value and behavior of different customer segments.
- Customer Retention & Loyalty Programs: Identify at-risk customers early and implement targeted retention efforts, boosting customer lifetime value.
This Python code provides a robust and well-commented solution for customer segmentation using RFM and K-Means clustering.
Key Components and Functionality:
- Synthetic Data Generation: Creates a sample transactions_df that mimics real-world e-commerce sales data, including CustomerID, OrderDate, and OrderTotal.
- RFM Calculation: Computes Recency (days since last purchase), Frequency (total purchases), and Monetary (total spend) for each customer using pandas aggregation.
- Data Preprocessing:
- Applies a log transformation to Frequency and Monetary values to handle their typically skewed distributions.
- Uses StandardScaler from sklearn.preprocessing to normalize all RFM features, ensuring that no single metric disproportionately influences the clustering.
- Optimal Cluster Determination: Implements both the Elbow Method and Silhouette Score to help you visually determine the most appropriate number of clusters (K) for K-Means.
- K-Means Clustering: Applies the KMeans algorithm from sklearn.cluster to the scaled RFM data to assign each customer to a segment.
- Cluster Profiling: Calculates the average RFM values for each cluster, enabling you to understand and name the distinct customer segments (e.g., "Champions," "At-Risk," "Loyal").
- Visualization: Generates several plots using matplotlib and seaborn:
- A 2D scatter plot of Recency vs. Frequency, with Monetary value represented by point size and clusters by color.
- Bar charts showing the average Recency, Frequency, and Monetary values for each cluster.
- A 3D scatter plot of the scaled RFM dimensions, providing a comprehensive view of the clusters in the feature space.
- Integration Hooks: Demonstrates how to save the trained KMeans model and the StandardScaler using joblib. It also outlines how these saved components can be loaded and used to segment new customer data, and discusses integration with databases, marketing automation platforms, and dashboarding tools.
How to Use and Extend:
- Replace Synthetic Data: The most important first step is to replace the generate_synthetic_transaction_data() function with your actual e-commerce transaction data. Ensure your real data has CustomerID, OrderDate, and OrderTotal (or similar columns that can be mapped).
- Refine K: Carefully examine the Elbow Method and Silhouette Score plots generated by the code. The "elbow" in the SSE plot and the highest Silhouette Score typically indicate good candidates for OPTIMAL_K. Adjust the OPTIMAL_K variable accordingly.
- DBSCAN/Hierarchical Clustering: If your data has irregularly shaped clusters or you want to explore density-based clustering, you can uncomment and experiment with DBSCAN or AgglomerativeClustering (Hierarchical Clustering) from sklearn.cluster as mentioned in the project overview. Remember to adjust preprocessing if needed.
- Profile Naming: Based on the cluster_profiles output, assign meaningful names to your clusters (e.g., "Champions," "New Loyalists," "Churn Risks," "Slipping Away"). This is crucial for actionable insights.
- Deployment: For a production environment, you would integrate the model loading and prediction logic into your existing e-commerce backend system (e.g., a Flask/FastAPI endpoint) to segment customers in real-time or batch as new data arrives.
- Continuous Improvement: Periodically retrain your model with fresh data to ensure your customer segments remain accurate and relevant as customer behavior evolves.
This comprehensive code provides a strong foundation for your customer segmentation project, enabling targeted marketing and improved customer relationship management.
Project 5: Customer Segmentation Using RFM + Clustering Codes:
🔗 View Project Code on GitHub🎯 Conclusion
In an age where attention is currency and personalization is power, businesses can no longer afford to treat all customers the same. This Customer Segmentation System doesn’t just crunch numbers—it unlocks behavioral intelligence. It transforms raw transaction data into strategic insights, helping you truly understand who your customers are, what they want, and how they behave.
By combining RFM analysis with the precision of clustering algorithms, this system moves marketing from guesswork to data-backed certainty. It allows brands to speak the language of each segment—whether you're rekindling a fading relationship or nurturing your highest-value champions. The result? Sharper campaigns, reduced churn, increased loyalty, and a significantly higher return on every marketing rupee spent.
But this isn’t just about better segmentation—it’s about smarter growth. With dynamic dashboards, integration-ready models, and a feedback loop that evolves with your audience, the system becomes a living, learning engine. It empowers teams across marketing, CRM, product, and support to act with precision and empathy.
📌 This is personalization at scale.
📌 This is marketing that listens before it speaks.
📌 This is how you turn customers into communities—and transactions into trust.
6)🌍 Real-Time Climate Impact Analyzer Using Satellite & IoT Data Fusion

Overview: Understanding and mitigating climate change requires comprehensive, real-time data from various sources. This project addresses the challenge of integrating disparate environmental data streams to create a powerful Real-Time Climate Impact Analyzer. By fusing high-resolution satellite imagery with granular, on-the-ground IoT sensor data, this system provides an unprecedented holistic view of environmental conditions. This convergence of macro-level satellite observations and micro-level localized measurements allows for dynamic monitoring of critical climate metrics, early detection of environmental changes, and more informed decision-making for sustainability initiatives, conservation efforts, and climate resilience planning. It's a vital tool for moving beyond static reports to dynamic, actionable environmental intelligence.
Why It Wins: This project offers a truly comprehensive approach to environmental monitoring, going beyond single data sources. By combining the vast, wide-area coverage of satellite data with the precise, localized detail of IoT sensors, it creates a powerful synergy. This fusion enables not just monitoring but also the detection of subtle changes and anomalies in real-time, which is crucial for early intervention in environmental crises, accurate ESG (Environmental, Social, and Governance) reporting, and effective conservation strategies. It moves environmental awareness from retrospective analysis to proactive real-time intelligence.
Objective: The primary objective is to create an intelligent system that seamlessly fuses real-time data from satellite imagery and distributed IoT sensors to continuously track and analyze critical climate and environmental metrics. This system aims to provide actionable insights for anomaly detection, trend identification, and comprehensive environmental monitoring, supporting decision-makers in sustainability, conservation, and regulatory compliance.
About the Project: This project represents a cutting-edge approach to environmental intelligence, focusing on the sophisticated task of data fusion from fundamentally different sources: broad-scale satellite observations and localized ground-truth IoT measurements.
The system will leverage Google Earth Engine (GEE) as a powerful platform for accessing, processing, and analyzing vast archives of satellite imagery (e.g., from Sentinel, Landsat) and other geospatial datasets. GEE's capabilities enable on-the-fly analysis of large-scale environmental indicators such as deforestation rates, water body changes, vegetation health (NDVI), land use change, and urban heat islands.
Concurrently, the project integrates data from a network of IoT sensors deployed in specific areas. These sensors, communicating via protocols like MQTT, will collect granular, real-time environmental parameters such as temperature, humidity, air quality (PM2.5, CO2), soil moisture, and water levels. This ground-level data provides crucial localized context and validation for the broader satellite observations.
The core intelligence of the system lies in applying Machine Learning (ML) models to this fused dataset. Convolutional Neural Networks (CNNs) built with frameworks like PyTorch will be instrumental for analyzing patterns and changes within the satellite imagery (e.g., detecting deforestation, water pollution, or urban expansion from visual data). Simultaneously, anomaly detection algorithms will be applied to both satellite and IoT data streams to identify unusual patterns or sudden shifts in environmental metrics, potentially signaling environmental degradation, pollution events, or climate-related hazards. These anomalies could be identified through statistical methods, machine learning techniques like Isolation Forest or One-Class SVM, or time-series specific anomaly detection.
All these processed insights and real-time data streams will be displayed on dynamic and intuitive Grafana dashboards. Grafana's visualization capabilities will allow users to monitor key environmental indicators, view spatial data overlays, receive alerts on detected anomalies, and track trends over time, providing a comprehensive and digestible overview of the climate impact in specific regions. This comprehensive view enables precise identification of environmental issues and supports timely, targeted interventions.
Stack & Tools: Google Earth Engine (JavaScript API or Python API), PyTorch (for CNNs and other ML models), MQTT (for IoT data ingestion), Grafana (for visualization and alerting), Python (for data processing, ML model development, API integration), potentially Edge devices (e.g., Raspberry Pi, ESP32) for IoT sensor deployment. Algorithms & Techniques: Convolutional Neural Networks (CNNs) for image classification, segmentation, and change detection; Anomaly Detection algorithms (e.g., Isolation Forest, One-Class SVM, statistical process control, time-series anomaly detection); Data Fusion techniques (e.g., Kalman filters, weighted averaging, machine learning-based fusion); Time-series analysis; Geospatial analysis.
How to Build:
- Data Acquisition & Sensor Deployment:
- Acquire satellite data (e.g., Sentinel-2, Landsat-8) from Google Earth Engine.
- Design and deploy IoT sensor nodes (e.g., using Raspberry Pi or ESP32 with relevant environmental sensors) to collect localized data (temperature, humidity, air quality, etc.).
- Configure MQTT brokers and clients for real-time data transmission from IoT devices.
- Data Ingestion & Synchronization:
- Set up data pipelines to ingest satellite data from GEE (via its API) and real-time sensor data via MQTT.
- Implement robust synchronization mechanisms using timestamps and geolocation to accurately fuse data points from diverse sources.
- Data Preprocessing & Feature Engineering:
- Clean, normalize, and preprocess both satellite imagery (e.g., atmospheric correction, cloud masking) and IoT sensor data (e.g., handling missing values, outlier detection).
- Extract relevant features from satellite imagery (e.g., NDVI, NDWI, specific band ratios) and time-series features from sensor data (e.g., moving averages, variance).
- Machine Learning Model Development:
- Develop and train CNN models using PyTorch for tasks like land cover classification, change detection in satellite imagery, or identifying specific environmental phenomena.
- Implement anomaly detection algorithms on both individual data streams and the fused dataset to identify unusual environmental events or deteriorating conditions.
- Data Storage & Database: Choose a suitable database (e.g., time-series database like InfluxDB or a NoSQL database like MongoDB) to store the processed and fused data for efficient retrieval and analysis.
- Visualization & Dashboard Development:
- Develop dynamic and interactive dashboards using Grafana.
- Display satellite imagery overlays, real-time sensor readings, anomaly alerts, historical trends, and summary statistics of climate metrics.
- Implement alerting mechanisms within Grafana to notify stakeholders of critical environmental changes.
- System Integration & Deployment:
- Integrate all components: data ingestion, processing, ML models, and visualization.
- Deploy the entire system (e.g., on cloud platforms like AWS, GCP, or a dedicated server) to ensure continuous operation.
- Testing & Validation: Thoroughly test the system's accuracy in data fusion, anomaly detection, and visualization. Validate insights against ground truth or expert knowledge. Continuously refine models and system architecture based on performance and new data.
Use Cases & Impact:
- Environmental NGOs & Conservation Organizations: Monitor deforestation, illegal mining, pollution events, and track biodiversity changes in protected areas, enabling rapid response.
- Government Agencies: Aid in climate policy formulation, disaster preparedness (e.g., flood monitoring, wildfire risk assessment), and compliance monitoring for environmental regulations.
- Corporations (ESG Reporting): Enable accurate and transparent Environmental, Social, and Governance (ESG) reporting by providing verifiable data on environmental impact, resource consumption, and sustainability initiatives.
- Urban Planning: Inform smart city initiatives by monitoring air quality, urban heat island effects, and green space health.
- Agriculture: Optimize crop management and water usage by monitoring soil moisture and vegetation health from space and ground.
- Research Institutions: Provide a rich, integrated dataset for climate science research and modeling.
Project 6: Real-Time Climate Impact Analyzer Using Satellite & IoT Data Fusion Codes:
🔗 View Project Code on GitHub🌍 Conclusion
The climate crisis doesn’t wait—and neither should our response. The Real-Time Climate Impact Analyzer represents a paradigm shift in environmental intelligence, uniting the sky-wide reach of satellite imagery with the ground-level precision of IoT sensors. It's not just about seeing more—it's about understanding deeper, acting faster, and deciding smarter.
In an era plagued by fragmented data and delayed reports, this system delivers real-time, hyperlocal, and global environmental insights in one cohesive platform. With machine learning at its core, it evolves continuously—spotting anomalies before they escalate, tracking change before it becomes irreversible, and turning raw environmental data into actionable foresight.
From protecting rainforests to enabling ESG accountability, from smarter disaster response to evidence-backed urban planning—this project doesn’t just measure the planet; it helps heal it.
🚀 This is not another dashboard.
🔍 It’s a climate sentinel, watching the Earth in real-time.
📊 It’s intelligence that empowers action, not just observation.
Built at the intersection of Earth and code, this analyzer turns data into duty—and vision into velocity.

🚀 Ready to turn your passion for data into real-world intelligence?
At Huebits, we don’t just teach Data Science — we train you to solve real problems with real data, using industry-grade tools that top tech teams trust.
From messy datasets to powerful machine learning models, you’ll gain hands-on experience building end-to-end AI systems that analyze, predict, and deliver impact.
🧠 Whether you’re a student, aspiring data scientist, or future AI architect, our Industry-Ready Data Science, AI & ML Program is your launchpad. Master Python, Pandas, Scikit-learn, Power BI, model deployment with Flask, and more — all by working on real-world projects that demand critical thinking and execution.
🎓 Next Cohort Starts Soon!
🔗 Join Now and secure your place in the AI revolution shaping tomorrow’s ₹1 trillion+ data-driven economy.
7)🏠 Real Estate Price Prediction App
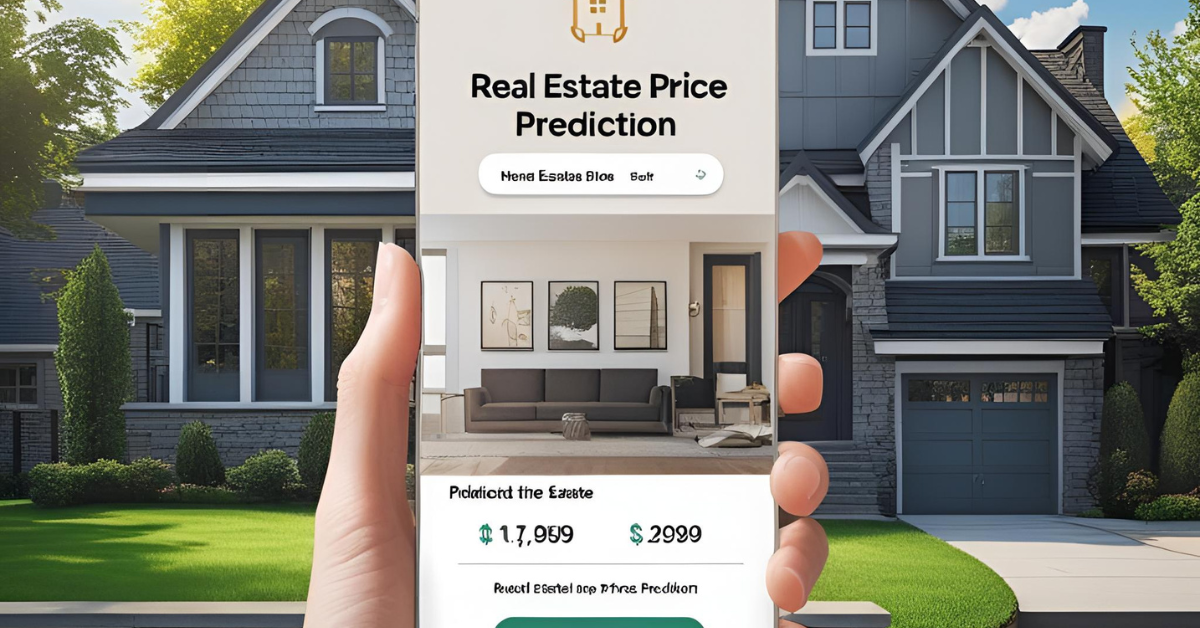
Overview: The real estate market, whether for buying, selling, or investing, is often characterized by information asymmetry and complex pricing dynamics. This project aims to bring transparency and data-driven insights to this sector by developing a Real Estate Price Prediction App. This application leverages advanced machine learning models to provide accurate property value estimates based on a multitude of factors, including geographical location, property characteristics, and neighborhood amenities. By empowering buyers, sellers, investors, and real estate professionals with reliable, data-backed valuations, the app facilitates more informed decision-making, streamlines transactions, and enhances overall market transparency, reducing guesswork and speculation.
Why It Wins: This project provides a tangible solution to a common pain point in the real estate market: determining fair property values. By offering data-driven price estimates, it empowers all stakeholders – from individual homebuyers to real estate agents and investors – to make more confident and strategic decisions. This transparency fosters greater trust in the market, helps avoid overpaying or underselling, and significantly improves the efficiency of property transactions, making the entire process more equitable and predictable.
Objective: The primary objective is to build a highly accurate and user-friendly predictive application that estimates real estate property prices. The model will account for a comprehensive set of influential factors, including intrinsic property features (e.g., number of bedrooms, bathrooms, square footage), geographical location (e.g., latitude, longitude, neighborhood), and proximity to essential amenities (e.g., schools, hospitals, public transport, parks), thereby providing realistic and reliable valuations.
About the Project: This project involves the development of a sophisticated machine learning model and an intuitive web application to predict real estate prices. The foundation of the system lies in collecting and meticulously analyzing a rich dataset of real estate listings. This data will include not only standard property attributes (like number of bedrooms, bathrooms, total area, property type) but critically, also geographical information (e.g., latitude, longitude, suburb, postcode).
A key focus will be on feature engineering, especially the creation of spatial features. This involves extracting insights from geographical data, such as:
- Proximity to Points of Interest (POIs): Calculating distances to important amenities like schools, hospitals, public transportation hubs, shopping centers, parks, or even major employment centers. This can be done using libraries like GeoPandas for spatial operations.
- Neighborhood Characteristics: Aggregating data about the surrounding area, such as average income, crime rates, or school district ratings (if available and relevant to the dataset).
- Density of Amenities: Counting the number of certain POIs within a given radius.
The core of the predictive power will come from a Gradient Boosting algorithm, specifically XGBoost (Extreme Gradient Boosting). XGBoost is chosen for its robustness, ability to handle various data types, and proven performance in tabular data prediction tasks. It excels at capturing complex non-linear relationships between property features and prices, effectively handling interactions between variables. The model will be trained on the prepared dataset to learn these intricate patterns.
Finally, the project will culminate in an interactive web application built with Streamlit. This user interface will allow users to input property details and visualize the predicted price along with explanations of the key factors influencing the prediction (e.g., which features contributed most to the valuation). The app will be designed for ease of use, making complex predictions accessible to a wide audience.
Stack & Tools: Python (Pandas for data manipulation, GeoPandas for spatial data handling), XGBoost (for the core predictive model), Streamlit (for building the interactive web application), potentially Folium/Plotly for interactive maps, Scikit-learn (for preprocessing and model evaluation). Algorithms & Techniques: Gradient Boosting (XGBoost is the primary choice, but others like LightGBM or CatBoost could be considered), Ensemble Methods, Spatial Data Analysis (Nearest Neighbors, Buffering, Geospatial joins), Regression Analysis, Feature Engineering.
How to Build:
- Data Collection: Acquire diverse real estate listing datasets. This could involve scraping public real estate portals (ethically and legally), using publicly available datasets (e.g., Kaggle, government housing data), or commercial APIs. Ensure the data includes property attributes, location (address, lat/long), and historical selling prices.
- Data Cleaning & Preprocessing: Handle missing values, outliers, and inconsistent data formats. Convert categorical features into numerical representations (e.g., one-hot encoding).
- Feature Engineering (with a focus on spatial aspects):
- Derive new features from existing ones (e.g., price per square foot, age of property).
- Crucially, extract and create spatial features:
- Use GeoPandas to work with geographical coordinates.
- Calculate distance to nearest schools, hospitals, public transport stations, parks, shopping malls, etc., using spatial queries or pre-computed POI datasets.
- Aggregate property values or amenities within specific geographical boundaries (e.g., zip codes, neighborhoods).
- Consider latitude and longitude directly as features or convert them into grid-based features.
- Model Training:
- Split the dataset into training and testing sets.
- Train the XGBoost regression model on the engineered features to predict property prices.
- Tune hyperparameters of the XGBoost model using techniques like GridSearchCV or RandomizedSearchCV for optimal performance.
- Model Evaluation: Evaluate the model's performance using regression metrics such as Mean Absolute Error (MAE), Root Mean Squared Error (RMSE), R-squared, and Mean Absolute Percentage Error (MAPE) on the test set.
- Interactive UI Development:
- Build a user-friendly web application using Streamlit.
- Design input fields for users to enter property characteristics (e.g., number of rooms, area, address).
- Display the predicted price prominently.
- (Optional but Recommended): Show feature importance or SHAP values to explain which features contributed most to the prediction for a given input.
- (Optional): Incorporate interactive maps (e.g., using Folium or Plotly) to visualize the property's location and nearby amenities.
- Deployment & Continuous Improvement:
- Deploy the Streamlit application (e.g., Streamlit Cloud, Heroku, AWS EC2).
- Establish a mechanism for continuous data updates and model retraining to ensure the predictions remain accurate as market conditions change.
- Gather user feedback for ongoing improvements.
Use Cases & Impact:
- Individual Buyers & Sellers: Empowers them with independent, data-driven valuations, leading to more confident negotiations and better deals.
- Real Estate Agents: Provides a powerful tool for quick property appraisals, pricing strategies, and demonstrating market expertise to clients.
- Real Estate Investors: Helps identify undervalued properties or assess the potential return on investment for rental properties.
- Property Developers: Aids in site selection and pricing new constructions based on market demand and comparable properties.
- Banks & Lenders: Supports more accurate property appraisals for loan approvals and mortgage assessments.
- Real Estate Portals: Enhance their platform's value by offering advanced predictive analytics directly to their users.
Project 7: Real Estate Price Prediction App Codes:
🔗 View Project Code on GitHub🏡 Conclusion
In an industry driven by speculation and emotional decision-making, the Real Estate Price Prediction App delivers what the market truly craves: clarity, consistency, and confidence.
By marrying spatial analytics with powerful machine learning, this project transforms fragmented real estate data into a transparent, intelligent valuation engine. It doesn’t just crunch numbers—it deciphers the story behind every property. From the distance to the nearest school to the density of parks in a neighborhood, this app captures the subtle yet decisive factors that shape property values.
Built on the muscle of XGBoost and the elegance of Streamlit, the system empowers users—whether first-time buyers, seasoned investors, or realtors—to move beyond hunches and into data-driven negotiations. The app democratizes property insights, leveling the playing field in a market traditionally clouded by information silos and market manipulation.
💡 This isn’t just a tool.
💸 It’s a decision-making engine.
📈 A digital real estate analyst in your pocket.
As housing markets fluctuate and cities expand, this app stands as a future-proof compass—constantly learning, adapting, and guiding users through the dynamic maze of real estate with intelligence, transparency, and trust.
8) 🎮 AI-Driven Script Success Predictor for OTT Platforms
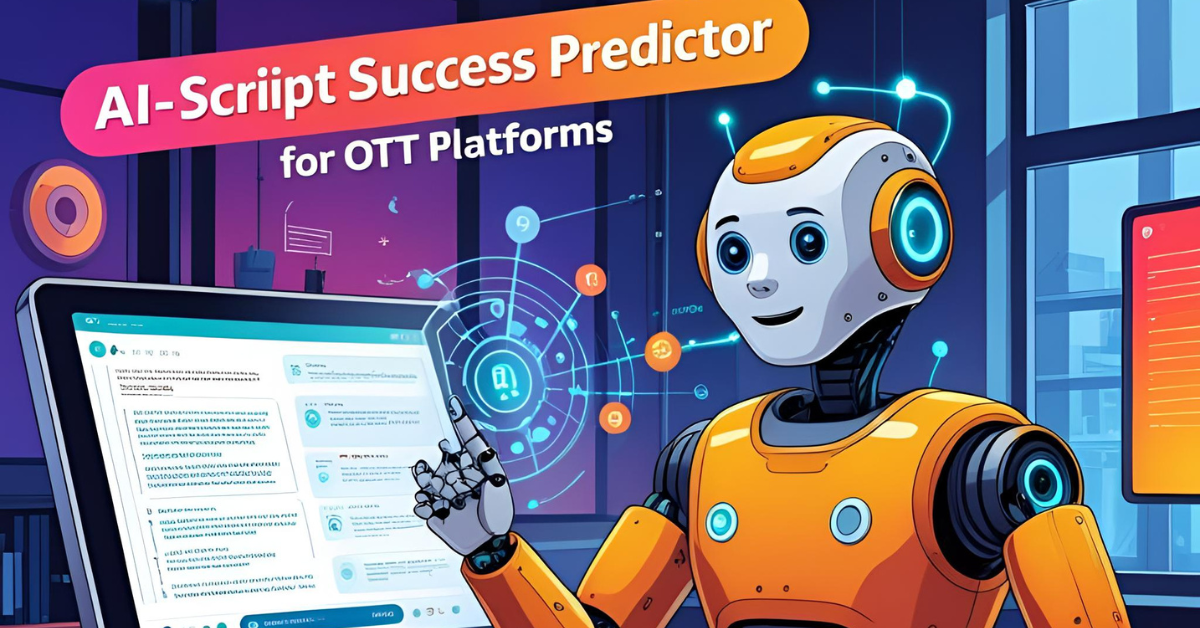
Overview: In the highly competitive Over-The-Top (OTT) streaming market, content creation is a high-stakes gamble. Producing a successful show or movie requires massive investments, and the risk of failure is significant. This project introduces an innovative AI-Driven Script Success Predictor designed to mitigate this risk. By applying advanced Natural Language Processing (NLP) to analyze creative content (scripts) and correlating these insights with historical viewer engagement and success metrics, this system provides data-driven forecasts of a content piece's potential performance. This empowers OTT platforms, production houses, and content creators to make more informed "greenlighting" decisions, optimize content acquisition strategies, and ultimately reduce financial risk while maximizing the probability of producing audience-engaging hits.
Why It Wins: This project offers a truly unique value proposition by bringing data science directly into the creative decision-making process of content production. It helps OTT platforms and content creators significantly reduce financial risk by providing an early forecast of a show's potential success, based on intrinsic script qualities and historical audience behavior. This translates into smarter investments, more compelling content lineups, and a higher likelihood of capturing and retaining subscriber attention in a fiercely competitive market.
Objective: The primary objective is to develop a predictive AI model that can forecast the success probability of a TV show or movie based on its script analysis and correlation with audience behavioral engagement metrics. The system aims to identify key narrative, emotional, and structural elements within a script that are strong indicators of future viewer retention, positive ratings, and overall content appeal.
About the Project: This project combines the power of natural language processing (NLP) with predictive modeling to analyze the intricate relationship between a creative script and its potential for success on an OTT platform.
The core of the project involves two main data streams:
- Script Data: Raw text scripts of various TV shows and movies.
- Success Metrics Data: Corresponding historical performance data for these shows, including:
- Viewer Retention Rates: How many viewers started and completed the show/episodes.
- Audience Ratings: User ratings, critic scores, and potentially social media sentiment.
- Watch Time: Total hours watched.
- Subscription Lift/Churn Reduction: Impact on subscriber numbers.
Natural Language Processing (NLP) Pipelines will be central to extracting meaningful features from the scripts. This includes:
- Sentiment Analysis: Identifying the overall emotional tone (positive, negative, neutral) of scenes, dialogues, or character arcs.
- Emotion Detection: Going beyond sentiment to detect specific emotions expressed by characters or evoked in the narrative (e.g., joy, sadness, anger, fear, surprise). Tools like HuggingFace Transformers can be leveraged for state-of-the-art emotion detection models, and libraries like NLTK can be used for foundational text processing (tokenization, stop word removal, stemming/lemmatization).
- Emotional Arc Extraction: Analyzing how emotional states change throughout the script, identifying patterns like "rags-to-riches," "Icarus," or "Oedipus" emotional trajectories, which research suggests correlate with narrative appeal.
- Character Analysis: Identifying the prominence and emotional profiles of main characters.
- Genre and Keyword Extraction: Identifying underlying genres and key themes within the script.
- Readability Scores: Assessing the complexity of the language.
Once these rich features are extracted from the scripts, they will be combined with the quantitative viewer engagement metrics. A regression or classification model (e.g., Logistic Regression for binary success/failure, or a regression model for predicting a rating score or retention percentage, possibly using ensemble methods like Random Forests or Gradient Boosting) will then be trained to learn the correlation between these script-derived features and the actual success metrics.
The project will culminate in a visualization layer, likely using Tableau (or a custom dashboard) to present the predicted success probability and highlight the key script features that contributed to that prediction. This allows content executives to understand why a script is predicted to succeed or fail, facilitating data-driven decision-making in the highly subjective world of content creation.
Stack & Tools: HuggingFace Transformers (for advanced NLP, pre-trained models), NLTK (for foundational NLP tasks), Scikit-learn (for classical ML models), Pandas (for data manipulation), Tableau (for visualization and interactive dashboards). Algorithms & Techniques: Natural Language Processing (Tokenization, Embeddings, Sentiment Analysis, Emotion Detection, Named Entity Recognition), Text Feature Extraction (TF-IDF, Word Embeddings like Word2Vec/GloVe, BERT-based embeddings), Classification Models (Logistic Regression, SVM, Random Forests, Gradient Boosting Classifiers), Regression Models (Linear Regression, Random Forests Regressor, Gradient Boosting Regressor), Time-series analysis (if incorporating dynamic viewership data over time), Correlation Analysis.
How to Build:
- Data Collection:
- Acquire a dataset of film/TV show scripts. Publicly available screenplays or licensed datasets are options.
- Collect corresponding success metrics for these shows: box office revenue (for films), viewer numbers, completion rates, IMDB/Rotten Tomatoes ratings, audience reviews from streaming platforms (if accessible).
- Text Preprocessing: Clean the script text (remove stage directions, character names where appropriate, special characters), tokenize, remove stop words, perform stemming/lemmatization using NLTK.
- Feature Extraction with NLP:
- Sentiment Analysis: Apply sentiment analysis tools (e.g., from NLTK, TextBlob, or pre-trained HuggingFace models) to extract sentiment scores for each scene, character, or the entire script.
- Emotion Detection: Use advanced models from HuggingFace Transformers (e.g., distilbert-base-uncased-finetuned-sst-2-english or more specific emotion models) to detect nuanced emotions.
- Emotional Arc Mapping: Develop logic to plot and analyze the emotional trajectory of the script or key characters over time.
- Other Text Features: Extract features like vocabulary richness, readability scores, character count, dialogue density, and thematic keywords.
- Data Integration: Combine the extracted NLP features with the quantitative success metrics for each show/script.
- Model Training:
- Define "success" (e.g., a binary classification: hit/flop, or a regression target: predicted rating/retention).
- Split the data into training and testing sets.
- Train regression or classification models (e.g., Scikit-learn's RandomForestClassifier/Regressor or GradientBoostingClassifier/Regressor) on the combined dataset.
- Optimize model hyperparameters using cross-validation.
- Model Evaluation: Evaluate the model's performance using appropriate metrics:
- Classification: Accuracy, Precision, Recall, F1-score, ROC-AUC.
- Regression: MAE, RMSE, R-squared.
- Visualization & Reporting:
- Create interactive dashboards using Tableau (or Python libraries like Plotly/Dash).
- Display the predicted success probability for a given script.
- Visualize the most impactful features (e.g., using feature importance from tree-based models or SHAP values) that contribute to the prediction, allowing content creators to understand the "why."
- Provide comparative analysis of successful vs. unsuccessful content.
- Deployment (Optional but Recommended): Create a simple web interface (e.g., using Flask/Streamlit) where users can upload a script and get an instant success prediction.
Use Cases & Impact:
- OTT Platforms (e.g., Netflix, Amazon Prime Video): Inform greenlighting decisions, allocate production budgets more effectively, and acquire content that aligns with audience preferences.
- Film Studios & Production Houses: Prioritize which scripts to develop, assess market potential, and optimize content pipelines.
- Content Creators & Screenwriters: Gain data-driven feedback on their scripts, understand industry trends, and refine their storytelling to increase market viability.
- Investors in Entertainment: Make more informed investment decisions by assessing the predictive success of projects.
- Marketing Teams: Tailor marketing campaigns by understanding the inherent emotional appeal and themes of content even before production.
Project 8: AI-Driven Script Success Predictor for OTT Platforms Codes:
🔗 View Project Code on GitHub🎬 Conclusion
In a creative economy where storytelling meets staggering production costs, the AI-Driven Script Success Predictor emerges as a bold step toward de-risking creativity and elevating content intelligence. This project brings the cold precision of machine learning into the warm, intuitive realm of narrative design—bridging art and analytics in unprecedented ways.
By dissecting the emotional architecture, character dynamics, and linguistic texture of a script—and marrying these insights with viewer behavior data—it doesn’t just predict success; it helps shape it. It becomes a strategic lens through which studios, OTT platforms, and creators can pre-visualize audience reactions long before the first frame is shot.
💡 It’s not just prediction—it’s pre-production strategy.
🎯 Not just metrics—but meaning.
This is where data science becomes a producer, guiding greenlight decisions with the same depth of instinct a seasoned studio head would bring—only now with evidence-backed clarity. And as content battles intensify in the OTT space, the winners won’t just be those who create—it will be those who create intelligently.
In the future of storytelling, this tool is not just an add-on—it’s a creative compass, reshaping how ideas are evaluated, funded, and brought to life.

🚀 Ready to turn your passion for data into real-world intelligence?
At Huebits, we don’t just teach Data Science — we train you to solve real problems with real data, using industry-grade tools that top tech teams trust.
From messy datasets to powerful machine learning models, you’ll gain hands-on experience building end-to-end AI systems that analyze, predict, and deliver impact.
🧠 Whether you’re a student, aspiring data scientist, or future AI architect, our Industry-Ready Data Science, AI & ML Program is your launchpad. Master Python, Pandas, Scikit-learn, Power BI, model deployment with Flask, and more — all by working on real-world projects that demand critical thinking and execution.
🎓 Next Cohort Starts Soon!
🔗 Join Now and secure your place in the AI revolution shaping tomorrow’s ₹1 trillion+ data-driven economy.
9) 🧾 AI Invoice Scanner & Fraud Detector

Overview: Manual invoice processing is a laborious, error-prone, and security-vulnerable task for businesses of all sizes. The risk of human error, intentional fraud, or unauthorized payments can lead to significant financial losses and operational inefficiencies. This project introduces an innovative AI Invoice Scanner & Fraud Detector designed to revolutionize accounts payable processes. By seamlessly integrating Optical Character Recognition (OCR) with advanced anomaly detection algorithms, this system automates data extraction from invoices and, crucially, flags any suspicious patterns or deviations that could indicate fraudulent activity. This dual capability not only streamlines financial operations by reducing manual effort but also significantly strengthens financial controls, providing a robust defense against invoice fraud and ensuring data integrity.
Why It Wins: This project offers a critical solution for financial departments by automating a tedious process and simultaneously bolstering security. It not only speeds up invoice processing but, more importantly, acts as a vigilant guardian against financial fraud, a major concern for businesses. By automatically flagging anomalies, it helps prevent significant financial losses, enhances compliance, and frees up human resources for more strategic tasks, offering a strong return on investment in terms of both efficiency and security.
Objective: The primary objective is to develop an intelligent system that can automatically extract relevant data from various invoice formats using Optical Character Recognition (OCR) and then apply machine learning-based anomaly detection techniques to identify and flag suspicious patterns indicative of potential fraud or errors. This aims to enhance the accuracy, efficiency, and security of accounts payable processes.
About the Project: This project addresses a crucial need in financial operations by combining computer vision with machine learning to automate and secure invoice processing. The system's functionality is broken down into two main, interconnected phases:
- Invoice Data Extraction (Computer Vision & OCR):
- The first step involves utilizing Computer Vision techniques with libraries like OpenCV to process the image of an invoice. This includes pre-processing steps such as image enhancement, deskewing, binarization, and noise reduction to optimize the image quality for text recognition.
- Following image pre-processing, Optical Character Recognition (OCR) is performed using tools like PyTesseract (a Python wrapper for Google's Tesseract OCR engine). PyTesseract will be configured to identify and extract key fields from the invoice, such as invoice number, vendor name, invoice date, due date, item descriptions, quantities, unit prices, subtotal, tax amounts, and total amount. The challenge here often lies in handling diverse invoice layouts and variations. Techniques like template matching or more advanced layout analysis could be employed to accurately locate these fields.
- Fraud & Anomaly Detection (Machine Learning):
- Once the data is extracted, a crucial feature engineering phase begins. This involves transforming the raw extracted data into meaningful numerical features that can be fed into a machine learning model. Examples include:
- Total amount
- Number of unique items
- Difference between total amount and sum of line items (for detection of arithmetic errors or manipulation)
- Days until due date
- Vendor ID (can be encoded)
- Frequency of invoices from a specific vendor
- Invoice value deviation from historical averages for that vendor
- Duplicate invoice number check
- Unusual invoice dates (e.g., weekends, holidays)
- These engineered features will then be fed into an anomaly detection model. Isolation Forest is a strong candidate for this task. It is particularly effective at identifying outliers (anomalies) in high-dimensional datasets without requiring a pre-defined notion of "normal" data. It works by isolating observations by randomly selecting a feature and then randomly selecting a split value between the maximum and minimum values of the selected feature. Repeatedly doing this effectively "isolates" anomalies. Other algorithms like One-Class SVM or clustering-based anomaly detection could also be considered.
- The model will be trained on historical, legitimate invoice data to learn what "normal" invoice patterns look like. Any deviation from these learned patterns will be flagged as suspicious.
- The final output will be an intuitive interface that allows users to upload invoices, see the extracted data, and receive clear alerts for any detected anomalies or potential fraudulent patterns, enabling human review and intervention where necessary.
- Once the data is extracted, a crucial feature engineering phase begins. This involves transforming the raw extracted data into meaningful numerical features that can be fed into a machine learning model. Examples include:
Stack & Tools: Python, OpenCV (for image processing), PyTesseract (for OCR), Pandas (for data manipulation), Scikit-learn (for anomaly detection algorithms), Isolation Forest (specific algorithm), Streamlit (for building the interactive web application). Algorithms & Techniques: Optical Character Recognition (OCR), Image Preprocessing (e.g., binarization, deskewing, noise reduction), Feature Engineering, Anomaly Detection (Isolation Forest, One-Class SVM, K-Nearest Neighbors based anomaly detection), Clustering-based anomaly detection.
How to Build:
- Data Collection: Gather a diverse dataset of invoice images (e.g., PDFs, JPEGs, PNGs) and, if possible, corresponding ground truth data for key fields and fraud labels. This is crucial for training and validation.
- Image Preprocessing with OpenCV: Develop robust image preprocessing pipelines using OpenCV to enhance the invoice images for optimal OCR performance. This may include resizing, converting to grayscale, thresholding, deskewing, and removing artifacts.
- OCR Data Extraction with PyTesseract: Implement PyTesseract to perform OCR on the preprocessed invoice images. Write parsing logic to extract specific fields (invoice number, date, vendor, total amount, line items, etc.) from the raw OCR output, handling variations in invoice layouts. Regex and custom rules can be very useful here.
- Feature Engineering for Fraud Detection: From the extracted invoice data, engineer a rich set of numerical and categorical features relevant for fraud detection. This includes both static features (e.g., total amount, number of items) and derived features (e.g., frequency of vendor, standard deviation of past invoice amounts for a vendor, ratio of tax to subtotal).
- Anomaly Detection Model Training:
- Train an Isolation Forest model (or another chosen anomaly detection algorithm) on a dataset of legitimate invoices. The model learns the normal patterns.
- Define a threshold for anomaly scores to determine what constitutes a "suspicious" invoice.
- Streamlit Application Development:
- Build an interactive web application using Streamlit that allows users to upload an invoice image (PDF, JPG, PNG).
- Upon upload, the app will trigger the OCR process to extract data.
- The extracted data will then be fed into the trained anomaly detection model.
- The app will display the extracted invoice details and provide a clear indication (e.g., "Invoice is normal," "Potential Anomaly Detected - Fraud Score: X") along with reasons for flagging (e.g., "Unusual total amount for this vendor," "Duplicate invoice number").
- Alerting Mechanism: Implement a simple alerting mechanism within the Streamlit app or integrate with an external system (e.g., email notification) for flagged invoices.
- Testing & Refinement:
- Thoroughly test the OCR accuracy on various invoice formats.
- Validate the fraud detection model's ability to identify known fraudulent patterns and minimize false positives/negatives using a mixed dataset of legitimate and (simulated) fraudulent invoices.
- Continuously refine both the OCR parsing logic and the anomaly detection model based on real-world performance and feedback.
Use Cases & Impact:
- Accounts Payable Departments: Automate invoice data entry, significantly reducing manual effort, processing time, and human errors.
- Finance & Audit Teams: Enhance financial controls by automatically identifying suspicious or fraudulent invoices, preventing financial losses.
- Procurement: Verify vendor legitimacy and prevent unauthorized or duplicate payments.
- Compliance: Improve adherence to internal financial policies and external regulatory requirements by providing an audit trail for flagged transactions.
- Small to Large Businesses: Any organization that processes a significant volume of invoices can benefit from increased efficiency and reduced fraud risk.
Project 9: AI Invoice Scanner & Fraud Detector Codes:
🔗 View Project Code on GitHub📄 Conclusion
In an era where every invoice is both a transaction and a potential threat vector, the AI Invoice Scanner & Fraud Detector emerges as a transformative solution at the intersection of automation, intelligence, and security. It doesn't just read invoices—it understands them. And more importantly, it questions them.
By marrying OCR with anomaly detection, this system acts as both a digital accountant and a fraud watchdog. It automates the mundane yet critical task of data extraction, while simultaneously running advanced diagnostics to detect discrepancies invisible to the human eye. The result? A faster, smarter, and infinitely more secure financial process.
This project redefines financial operations not just as a back-office function but as a strategic advantage—one that proactively safeguards capital, enforces compliance, and liberates human talent to focus on innovation rather than administration.
🔍 From invoice scanning to fraud flagging, this is automation with accountability.
💼 Not just efficiency—but vigilance.
🛡️ Not just speed—but trust.
In a business world where one wrong invoice can cost millions, this tool stands as your first line of defense, a silent sentinel ensuring that every transaction is clean, correct, and compliant.
10)🤖 AI-Powered Chatbot for Student Counseling
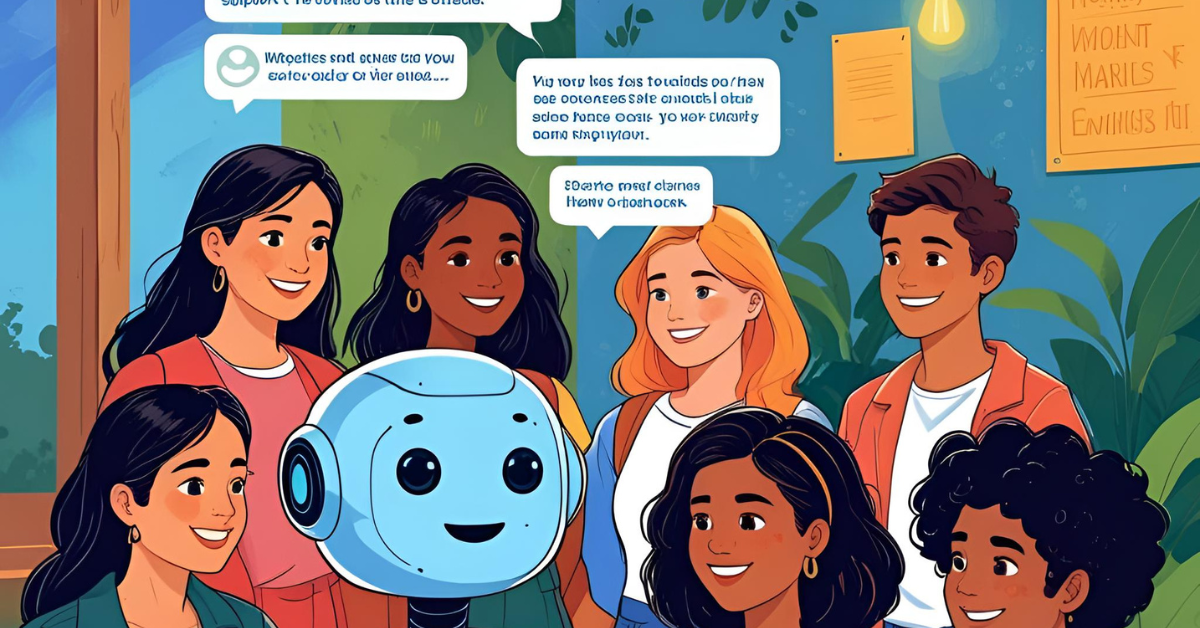
Overview: Students today face immense pressure, from academic performance and career uncertainties to mental health challenges and social adjustments. Traditional counseling services, while invaluable, often struggle with scalability and accessibility. This project aims to address these critical gaps by developing an AI-Powered Chatbot for Student Counseling. This intelligent conversational agent is designed to offer highly scalable, personalized, and empathetic support across multiple domains: career guidance, academic advice, and crucial mental wellness check-ins. By providing an immediate, confidential, and judgment-free platform, the chatbot serves as a vital first line of support, ensuring that more students have access to timely assistance and guidance, fostering a more supportive and responsive educational environment.
Why It Wins: This project offers a truly scalable solution to the growing demand for student support services. It provides accessible, personalized, and private assistance for critical areas like career planning and mental well-being, which are often underserved in traditional settings. By leveraging AI, the chatbot can handle a large volume of inquiries 24/7, offering continuous support, tracking student wellness over time, and freeing up human counselors for more complex cases, ultimately enhancing the overall student experience and success.
Objective: The primary objective is to develop an intelligent and empathetic chatbot capable of providing multi-faceted support to students. This includes offering personalized career advice, assisting with academic queries, conducting regular mood tracking, and facilitating mental health check-ins. The chatbot aims to be a confidential, accessible, and continuous resource, acting as a preliminary support system that can guide students to appropriate human resources when deeper intervention is required.
About the Project: This project focuses on building a sophisticated conversational AI designed specifically for the unique needs of students. The core of its functionality lies in its ability to understand and respond to a diverse range of student queries across different domains, leveraging advanced Natural Language Processing (NLP) and generative AI.
The project will involve:
- Intent Recognition: The chatbot will be trained to accurately identify the user's underlying intent behind their questions. This includes a broad spectrum of student-specific intents, such as:
- Career-related: "What courses should I take for a data science career?", "How do I write a resume?", "Tell me about job prospects in AI."
- Academic-related: "Where can I find resources for calculus?", "How do I improve my study habits?", "What are the deadlines for course registration?"
- Mental Health/Wellness: "I'm feeling stressed about exams," "How can I manage anxiety?", "I need someone to talk to."
- Logistical/Informational: "What's the library's operating hours?", "How do I apply for a scholarship?"
- Mood Tracking: "How are you feeling today?", "Tell me about your week." This intent classification will be handled using robust NLP frameworks like Rasa or by fine-tuning models from HuggingFace Transformers (e.g., BERT-based models) for highly accurate understanding.
- Dialogue Management: A crucial component will be the dialogue management system (e.g., provided by Rasa). This system maintains context throughout the conversation, ensuring coherent and relevant responses, guiding the user through multi-turn interactions, and handling follow-up questions effectively. It allows the chatbot to remember previous statements and tailor future responses based on the ongoing conversation.
- GPT-based Dialogue Generation: To ensure natural, empathetic, and highly varied conversational responses, the project will integrate Large Language Models (LLMs), specifically leveraging the OpenAI API (GPT-3.5 or GPT-4) or potentially Google's Gemini API. These models will be used to generate human-like text, providing personalized advice, elaborating on career paths, suggesting coping mechanisms, and engaging in supportive mental health check-ins. Careful prompt engineering will be vital to guide the LLM's responses to be safe, helpful, and aligned with counseling best practices.
- Personalization & Mood Tracking: The chatbot will have the capability to track user mood and well-being over time. By analyzing sentiment and keywords in student interactions, it can infer emotional states and store this (anonymized) data in a MongoDB database. This historical data will enable the chatbot to offer more personalized support, identify deteriorating mental health patterns, and prompt proactive check-ins or suggest reaching out to human counselors or campus resources when certain thresholds of distress are detected. The MongoDB database will also store conversation logs, user preferences, and potentially curated knowledge bases for specific queries.
- Resource Integration: The system will be designed to seamlessly refer students to relevant external resources, such as university counseling centers, career services websites, academic support programs, or crisis hotlines when the complexity or severity of the student's issue warrants human intervention.
Stack & Tools: Rasa (for NLU and dialogue management) or HuggingFace Transformers (for advanced NLP models), OpenAI API (for generative AI), Flask (for backend web application development), MongoDB (for data storage), Python (main programming language), potentially frontend frameworks like HTML/CSS/JavaScript. Algorithms & Techniques: Intent Classification (e.g., deep learning classifiers, SVM), Entity Recognition, Dialogue State Tracking, Policy Learning (in Rasa), Transformer-based Language Models (e.g., GPT, BERT for embeddings/fine-tuning), Sentiment Analysis, Keyword Extraction, Unsupervised Learning (e.g., clustering for identifying common student concerns).
How to Build:
· Define Intents & Entities: Thoroughly define the range of intents (e.g., greet, ask_career_advice, express_stress, ask_about_academics) and entities (e.g., course_name, job_role, emotion) that the chatbot should understand.
· Collect & Annotate Training Data: Create a diverse dataset of example user utterances for each intent. This data will be used to train the Natural Language Understanding (NLU) component.
· Build NLU & Dialogue Management:
- If using Rasa: Develop the NLU model (for intent classification and entity extraction) and define dialogue stories and rules to manage conversational flows.
- If using Transformers: Fine-tune a pre-trained transformer model (e.g., from HuggingFace) for intent classification. Implement custom logic for dialogue state tracking and response selection.
· Integrate Generative AI (OpenAI API): Develop logic to call the OpenAI API (or other LLM APIs) to generate dynamic, contextually relevant, and empathetic responses, especially for open-ended or emotionally charged queries. Implement prompt engineering to guide the LLM's behavior.
· Develop Personalization & Mood Tracking: Implement logic to:
- Extract sentiment and keywords from user inputs.
- Store interaction history and inferred mood in MongoDB for individual student profiles.
- Develop simple rules or ML models to trigger check-ins or referral suggestions based on detected mood patterns.
· Build Flask Backend: Create a Flask web application to serve as the backend for the chatbot. This will handle incoming messages, call the NLU and dialogue management components, interact with the LLM API, and manage the MongoDB database.
· Frontend Development (Optional but Recommended): Design a simple web-based user interface using HTML, CSS, and JavaScript for students to interact with the chatbot. Alternatively, integrate with existing messaging platforms.
· Deployment: Deploy the Flask application (e.g., on a cloud platform like AWS, Heroku, or Google Cloud) to make the chatbot accessible 24/7.
· Testing & Iteration: Conduct extensive user testing to evaluate conversation quality, accuracy of intent recognition, and helpfulness of responses. Gather feedback and continuously refine the NLU models, dialogue flows, LLM prompts, and personalization features based on real-world interactions. Ensure privacy and ethical considerations are paramount throughout.
Use Cases & Impact:
- Educational Institutions (Universities, Colleges, Schools): Supplement human counselors, provide after-hours support, offer initial guidance, and proactively identify students at risk.
- EdTech Platforms: Integrate as a feature to provide personalized learning support, career guidance, and academic assistance.
- Student Support Services: Scale mental health and career advising resources without proportional increases in human staff.
- Online Learning Platforms: Offer a virtual tutor or advisor for course-related queries and study habit guidance.
- Student Wellness Initiatives: Implement as part of broader well-being programs to promote self-care and easy access to support.
Project 10: AI-Powered Chatbot for Student Counseling Codes:
🔗 View Project Code on GitHub🎓 Conclusion
In the pressure-cooker environment of modern education, where students juggle academics, personal growth, career anxieties, and mental health battles—often in silence—the AI-Powered Student Counseling Chatbot stands as a quiet revolution.
This is more than just another chatbot. It’s a scalable support system, a non-judgmental companion, and a first responder to emotional and academic distress. By combining cutting-edge NLP, intent recognition, mood tracking, and the empathetic power of generative AI, it bridges the widening gap between student needs and available human support. Accessible 24/7, confidential, and deeply personalized, it democratizes care—making help available not just when it’s convenient, but when it’s critical.
Whether it’s a student seeking clarity on career paths, struggling with exam anxiety at midnight, or just needing someone to talk to—the chatbot is there. And it remembers, learns, adapts. It doesn’t replace human counselors but enhances their impact by catching the quiet cries for help before they turn into crises.
🧠 Intelligent.
💬 Empathetic.
🌱 Transformative.
This project doesn’t just automate—it humanizes tech, extending a digital hand to support real human lives. In doing so, it redefines student support for the next generation.
📌 Final Conclusion: Unlocking Your Future with Data Science in 2025
The ten projects detailed in this playbook are not just academic exercises—they are battle-tested blueprints for standing out in the hyper-competitive world of Data Science in 2025. Each project is a response to a real-world challenge: from decoding the risk of hospitalization before it’s too late, to detecting invoice fraud in milliseconds, to predicting the success of a streaming blockbuster before the first frame is shot.
But what sets this collection apart is relevance + readiness.
These projects are designed with industry-aligned stacks (like SHAP for XAI, HuggingFace for NLP, and Streamlit for deployment), real deployment potential, and the integration of ethical AI practices. They mirror what hiring managers, startups, and enterprise tech teams are looking for in the next-gen data professionals.
You're not just building models—you’re solving for trust, transparency, personalization, automation, and intelligence at the edge.
By building these projects, you will:
- Master end-to-end development: from data wrangling to model training, explainability, and deployment.
- Gain real-world confidence: because you’ve worked with messy data, uncertain patterns, and real human variables.
- Craft a portfolio that speaks: not just “I can code,” but “I can solve, I can scale, I can ship.”
In a landscape dominated by data, your edge is execution. The only thing left? Build. Ship. Share.
Let these 10 winning projects be your launchpad. Not just into 2025—but into the data-driven decade ahead. 🚀
This isn’t practice. This is the portfolio that lands you the job, wins the hackathon, gets the funding, and builds the future.

🚀 About This Program — Data Science, AI & ML
By 2030, data won't just be the new oil — it'll be the new oxygen. Every click, swipe, and sensor ping is generating oceans of data. But raw data is useless without people who can decode the chaos into clarity — data scientists who don’t just analyze, but strategize.
📊 The problem? Most programs churn out dashboard jockeys and textbook parrots. But the industry is starving for thinkers, builders, and decision scientists who can turn messy datasets into real-time, ROI-driving action.
🔥 That’s where Huebits flips the game.
We don’t train you to know data science.
We train you to do data science.
Welcome to a 6-month, project-heavy, industry-calibrated, Data Science, AI & ML Program — built to make you job-ready from day one. Whether it’s predicting churn, detecting fraud, forecasting demand, or deploying models in production, this program delivers hardcore practical skills, not just theory.
From mastering Python, Pandas, and Scikit-learn to deploying ML models with Flask — we guide you from raw data to real-world impact.
🎖️ Certification:
Graduate with a Huebits-certified credential, recognized by hiring partners, tech innovators, and industry mentors across sectors. This isn’t a paper trophy. It’s proof you can build, deploy, and deliver.
📌 Why It Hits Different:
Real-world industry projects
Mini capstone to build your portfolio
LMS access for a year
Job guarantee upon successful completion
💥 Your future team doesn’t care what you know — they care what you’ve built. Let’s give them something to notice.
🎯 Join Huebits’ Industry-Ready Data Science, AI & ML Program and turn your skills into solutions that scale.

🔥 "Take Your First Step into the Data Science Revolution!"
Ready to build real-world Data Science & AI projects that predict, automate, and actually deliver business impact?
Join the Huebits Industry-Ready Data Science, AI & ML Program and gain hands-on experience with data wrangling, predictive modeling, machine learning algorithms, model deployment, and visualization — using the exact tech stack the industry demands.
✅ Live Mentorship | 📊 Project-Driven Learning | 🧠 Career-Focused AI Curriculum