"Top 10 Trending Industrial IoT Projects for 2025 with Source Code"

Redefining Efficiency with Automation, Analytics, and Edge Intelligence
In today's industrial landscape, IoT isn't just a buzzword; it's the core backbone of smarter factories. It's driving huge leaps in predictive maintenance, real-time analytics, and energy optimization. As industries worldwide push towards smart manufacturing and Industry 4.0, these 10 cutting-edge Industrial IoT (IIoT) projects highlight the immediate future of intelligent automation and data-driven decision-making.
Industrial IoT (IIoT) truly is the crown jewel of smart manufacturing. It seamlessly links machines, advanced sensors, massive data streams, and powerful cloud platforms. All these elements work together to dramatically optimize efficiency, boost safety standards, and transform decision-making processes. These 10 battle-tested IIoT projects are carefully designed to digitize nearly every part of industrial operations. They cover everything from proactive predictive maintenance and detailed real-time asset tracking to advanced edge analytics and strong machine learning applications. They clearly show how connected intelligence can turn operational challenges into big advantages, ensuring industries are not just ready for the future, but actively building it.
Table of Content:
1. 🏗️ Real-Time Structural Health Monitoring System
2. 🧯 Industrial Fire Detection with Edge AI
3. ⚙️ Predictive Maintenance for CNC Machines
4) 🛢️ Industrial Tank Level Monitoring System
5. 🔄 Conveyor Belt Health Monitoring with ML
6. 🔒 Smart Industrial Access Control System
7. 📦 Industrial Package Integrity Detection
8. 🌀 Air Quality and Ventilation Monitoring in Plants
9. 🧊 Cold Chain Logistics Monitoring
10. 📡 Industrial Machine Energy Consumption Tracker
1. 🏗️ Real-Time Structural Health Monitoring System

Overview: In an age where infrastructure resilience and safety are paramount, this IoT Structural Health Monitoring System offers a transformative solution for continuously assessing the integrity of critical assets. This robust system is engineered to provide real-time, data-driven insights into the structural well-being of essential infrastructure such as bridges, large factory complexes, industrial sheds, and even civil engineering structures. By deploying a network of precision sensors, the system meticulously monitors key indicators like crack propagation, abnormal vibrations, and dynamic load stress. The data captured by these sensors is instantaneously transmitted to a secure cloud platform, enabling proactive detection of potential structural degradations. This proactive approach allows for timely preventive maintenance and swift emergency responses, significantly enhancing safety, extending asset lifespan, and preventing catastrophic failures, ultimately safeguarding human lives and valuable investments.
About the Project: This project involves the design and implementation of a comprehensive, end-to-end Industrial IoT (IIoT) solution for structural health monitoring. At its core, the system relies on the precise capture of physical parameters. Strain gauges, often paired with a high-resolution analog-to-digital converter like the HX711 amplifier, are meticulously mounted at critical stress points on the structure to measure deformation and strain. Concurrently, vibration sensors are strategically placed to detect oscillations and abnormal vibrational patterns that might indicate loose connections, material fatigue, or external stressors.
The collected analog data from these sensors is then digitized and processed by an ESP32 microcontroller. Chosen for its Wi-Fi capabilities and robust performance, the ESP32 acts as the edge device, collecting, aggregating, and preparing the sensor readings. It then securely publishes this real-time data using the lightweight MQTT protocol to AWS IoT Core. AWS IoT Core provides a secure and scalable gateway for ingesting data from thousands of edge devices, routing messages, and facilitating seamless integration with other AWS services.
On the cloud side, AWS IoT Core serves as the central hub. It processes the incoming data streams, where rules can be set up to filter, transform, and route data to various destinations. A critical component of the system is the real-time alerting mechanism: pre-defined thresholds for strain, vibration, or stress levels are established within AWS services (e.g., AWS IoT Analytics or AWS Lambda functions triggered by IoT Core rules). When these thresholds are breached, the system automatically triggers immediate notifications via SMS and/or Email alerts, ensuring that engineers and maintenance teams are instantly informed of potential structural anomalies.
Furthermore, the collected data is pushed to a time-series database and visualized on a Grafana dashboard. This interactive dashboard provides a comprehensive, graphical overview of the structure's health, allowing engineers to monitor trends, analyze historical data, identify long-term patterns, and visualize the impact of various loads over time. This continuous data stream and intelligent alerting capability transform reactive maintenance into a proactive, data-driven strategy, enabling early intervention and optimizing resource allocation.
Step-by-Step Procedure:
- Sensor Installation and Calibration:
- Mount strain gauges: Carefully affix strain gauges at critical stress points on the target infrastructure (e.g., bridge beams, factory columns, truss joints). Ensure proper surface preparation (cleaning, roughening) for optimal adhesion.
- Mount vibration sensors: Securely attach vibration sensors to areas prone to oscillation or where structural movement needs to be tracked.
- Initial calibration: Perform initial calibration of all sensors to establish baseline readings and ensure accuracy, accounting for temperature compensation and zero-point adjustments for strain gauges using the HX711.
- Hardware Interfacing and Amplification:
- Connect strain gauges: Wire the strain gauges to the HX711 amplifier breakout board. The HX711 is crucial for amplifying the minuscule voltage changes from the strain gauge into a measurable signal for the microcontroller.
- Connect vibration sensors: Connect the vibration sensors directly to appropriate analog or digital input pins on the ESP32 microcontroller, depending on the sensor type (analog output for continuous vibration measurement, digital for threshold detection).
- Power supply: Ensure a stable and appropriate power supply for both the ESP32 and the sensors/amplifiers.
- ESP32 Programming for Data Acquisition & Transmission:
- Sensor data acquisition: Program the ESP32 using the Arduino IDE or PlatformIO to continuously read data from the HX711 (for strain) and the vibration sensor. Implement averaging or filtering to reduce noise in the readings.
- Wi-Fi configuration: Configure the ESP32 to connect to a stable Wi-Fi network.
- MQTT Client Setup: Integrate an MQTT client library (e.g., PubSubClient) into the ESP32 firmware.
- AWS IoT Core Connection: Program the ESP32 to securely connect to AWS IoT Core using MQTT over TLS, providing the necessary certificates and endpoint details.
- Data Publishing: Format the sensor readings into a structured JSON payload (e.g.,
{"structure_id": "Bridge_A", "timestamp": "...", "strain": 123.45, "vibration": 0.67}), and program the ESP32 to publish this data periodically (e.g., every 5-10 seconds) to a specific MQTT topic on AWS IoT Core.
- AWS IoT Core Configuration & Data Routing:
- Create IoT Thing: Register the ESP32 device as an "IoT Thing" in AWS IoT Core and generate unique certificates for secure authentication.
- Define MQTT Topic: Create an MQTT topic for the ESP32 to publish data to (e.g.,
structure/monitor/data). - Set up IoT Core Rules: Configure AWS IoT Core rules to process incoming MQTT messages.
- Data Storage: Route the incoming JSON data to a time-series database (e.g., AWS Timestream) for historical analysis and Grafana integration.
- Anomaly Detection Trigger: Create additional rules to trigger AWS Lambda functions or AWS IoT Analytics pipelines when specific strain or vibration thresholds are met (e.g.,
SELECT * FROM 'structure/monitor/data' WHERE strain > 500 OR vibration > 0.8).
- Alerting System & Visualization Setup:
- Configure SMS/Email Alerts:
- Use AWS SNS (Simple Notification Service) to create topics for SMS and Email notifications.
- Program the AWS Lambda function (triggered by IoT Core rules) to publish messages to these SNS topics, sending immediate alerts with details of the anomaly (e.g., "ALERT: High strain detected on Bridge A - Strain: 620, Vibration: 0.9").
- Grafana Dashboard Development:
- Connect Grafana to your chosen time-series database (e.g., AWS Timestream).
- Design comprehensive dashboards with various panels to visualize:
- Real-time strain and vibration graphs.
- Historical trends and data points.
- Threshold lines to clearly indicate normal vs. abnormal ranges.
- Status indicators (e.g., green/red lights) for overall structural health.
- Anomaly logs with timestamps.
- Configure SMS/Email Alerts:
- System Testing, Validation, and Refinement:
- Unit Testing: Test each component (sensor, ESP32, MQTT connection, AWS rules, alerts) individually.
- Integrated System Testing: Deploy the complete system and simulate various conditions (e.g., applying known loads, inducing vibrations) to validate sensor readings, data flow, alerting accuracy, and dashboard responsiveness.
- Threshold Optimization: Continuously monitor the system and refine alarm thresholds based on real-world structural behavior and expert feedback to minimize false positives and negatives.
- Security Audit: Ensure all communication channels (ESP32 to AWS, AWS services) are secure and compliant with best practices.
Components & Tech Used:
- Edge Hardware: ESP32 Microcontroller, Strain Gauge (e.g., foil strain gauge), HX711 Amplifier (for high-precision weight/strain measurement), Vibration Sensor (e.g., SW-420 or a MEMS accelerometer).
- Connectivity: Wi-Fi, MQTT (Message Queuing Telemetry Transport).
- Cloud Platform: AWS IoT Core (for device connectivity, message routing, security), AWS Lambda (for serverless logic and alert triggering), AWS SNS (Simple Notification Service for SMS/Email alerts), AWS Timestream or another time-series database (for data storage).
- Visualization: Grafana (for real-time and historical data dashboards).
- Programming Languages/Tools: Arduino IDE/PlatformIO (for ESP32 firmware), Python (for AWS Lambda functions, data processing).
Benefits:
- Real-time Structural Safety: Provides immediate awareness of critical structural conditions, enabling rapid response to prevent failures.
- Proactive & Predictive Maintenance: Shifts from costly reactive repairs to data-driven preventive maintenance, extending asset lifespan and reducing downtime.
- Cloud-based Analytics & Dashboard: Offers centralized, scalable data storage and an intuitive visual dashboard for comprehensive structural health monitoring and trend analysis from anywhere.
- Enhanced Decision-Making: Equips engineers and facility managers with actionable insights to make informed decisions regarding maintenance schedules, repairs, and infrastructure investments.
- Reduced Operational Costs: Minimizes unexpected repair costs and avoids costly structural failures.
- Improved Compliance & Risk Management: Helps meet safety regulations and reduce liabilities associated with infrastructure integrity.
Project 1: Real-Time Structural Health Monitoring System Codes:
🔗 View Project Code on GitHub🏗️ Real-Time Structural Health Monitoring System – Code
🛠️ Requirements:
· ESP32
· Strain Gauge with HX711 amplifier
· Vibration Sensor (e.g., SW-420 or ADXL345)
· Wi-Fi network
· AWS IoT Core credentials (certificate, private key, endpoint)
· Arduino IDE with libraries: WiFi.h, PubSubClient.h
2. 🧯 Industrial Fire Detection

Overview: In industrial environments, swift and accurate detection of fires and gas leaks is paramount for ensuring worker safety, protecting valuable assets, and preventing catastrophic incidents. This project introduces an advanced AI-Powered Fire & Gas Detection System designed to revolutionize traditional safety protocols. By integrating sophisticated thermal cameras and sensitive gas sensors with the powerful NVIDIA Jetson Nano edge AI platform, this system performs real-time, on-device image classification and gas concentration analysis. Unlike conventional detectors, this AI-driven approach minimizes false alarms by intelligently distinguishing true threats from environmental noise. Upon detection of a fire or a dangerous gas leak, immediate alerts, including crucial visual and sensor data, are dispatched to the control room and simultaneously logged to a secure cloud database, facilitating rapid response and comprehensive incident reporting. This cutting-edge solution significantly enhances safety, reduces response times, and is scalable across a multitude of industrial sectors.
About the Project: This project focuses on building a robust, intelligent, and real-time safety monitoring system tailored for industrial settings. The core intelligence resides at the edge, directly on the NVIDIA Jetson Nano, a compact yet powerful AI computing platform designed for embedded applications.
The system's sensory input comes from two crucial types of devices:
- Thermal Cameras (MLX90640): The MLX90640 is a low-resolution thermal array sensor that can detect heat signatures without being affected by visible light. This is critical for detecting fires even in smoke-filled or dark environments. The thermal data stream provides a unique signature of heat, which is then fed into the AI model.
- Gas Sensors (MQ-135): The MQ-135 gas sensor is selected for its ability to detect a wide range of harmful gases, including ammonia, benzene, alcohol, smoke, and CO2, making it suitable for general air quality and leak detection. Its analog output is interpreted to gauge gas concentration levels.
The NVIDIA Jetson Nano serves as the central processing unit for this edge intelligence. It is responsible for:
- Data Acquisition: Receiving streams from the thermal camera and readings from the gas sensor.
- AI Inference: Running pre-trained machine learning models for real-time analysis. For fire detection, the thermal image data is processed using OpenCV for image manipulation and then fed into a TensorFlow Lite model. This model, optimized for edge devices, performs image classification to identify heat patterns characteristic of a fire. Concurrently, the gas sensor data is analyzed against predefined thresholds or even fed into a simpler ML model for anomaly detection.
- Edge AI Logic: The combination of OpenCV and TensorFlow Lite on the Jetson Nano ensures that the AI processing happens directly on the device, minimizing latency and reducing reliance on continuous cloud connectivity. This "edge AI" approach allows for faster detection and response.
Upon identifying a potential fire or gas leak, the system triggers an alert. The powerful Node-RED visual programming tool, running on the Jetson Nano or an associated gateway, is utilized to manage alert workflows. Node-RED allows for easy integration with various communication channels, enabling instant notifications via Telegram or Email to relevant personnel (e.g., control room operators, safety managers, emergency services). Simultaneously, all critical event data, including timestamps, sensor readings, and incident type, is logged to a secure cloud database like Firebase. Firebase provides real-time database capabilities, authentication, and hosting, ensuring data persistence, scalability, and easy access for post-incident analysis and reporting.
A key aspect of this project is the ability to continuously improve the AI model by training it further using on-site anomaly data. This iterative process allows the system to adapt to specific factory environments, reducing false positives and improving detection accuracy over time, making it highly robust and tailored to the unique operational conditions.
Step-by-Step Procedure:
- Sensor Deployment and Integration:
- Strategic Sensor Mounting: Carefully mount the MLX90640 thermal sensor and MQ-135 gas sensor at strategic vantage points within factory zones, covering high-risk areas, machinery, and potential gas accumulation points. Consider factors like line-of-sight for thermal cameras and air circulation for gas sensors.
- Physical Connection: Connect the thermal sensor (typically via I2C) and the gas sensor (via an analog-to-digital converter if necessary, or directly to GPIO pins for modules with digital output) to the NVIDIA Jetson Nano development board. Ensure stable power supply and proper wiring.
- Jetson Nano Setup & Model Loading:
- Operating System & Drivers: Install the NVIDIA JetPack SDK on the Jetson Nano, which includes the necessary Linux OS, GPU drivers, and AI libraries.
- Environment Setup: Set up a Python environment and install required libraries: OpenCV, TensorFlow Lite (or full TensorFlow if hardware permits), NumPy, and libraries for sensor communication.
- Pre-trained Model Loading: Load a pre-trained fire detection model (e.g., a lightweight CNN model converted to TensorFlow Lite format) onto the Jetson Nano. This initial model provides baseline detection capabilities.
- Edge AI Logic Development & Implementation:
- Thermal Image Processing (OpenCV & TensorFlow Lite):
- Write Python code using OpenCV to capture frames from the MLX90640 thermal sensor.
- Pre-process these thermal images (e.g., resizing, normalization) to match the input requirements of the TensorFlow Lite model.
- Run inference using the loaded TensorFlow Lite model on the processed thermal images to classify them as "fire" or "no fire."
- Gas Sensor Data Analysis: Continuously read data from the MQ-135 sensor. Implement logic to convert analog readings to gas concentration levels and compare them against predefined safe thresholds.
- Fusion & Decision Logic: Implement edge AI logic that combines inputs from both the thermal and gas sensors. For instance, a fire alert might be triggered by a high thermal signature and a spike in smoke-related gas readings, reducing false positives.
- Thermal Image Processing (OpenCV & TensorFlow Lite):
- Alerting & Cloud Logging with Node-RED & Firebase:
- Node-RED Workflow Development: Install and configure Node-RED on the Jetson Nano or an adjacent gateway.
- Integration with AI Output: Create Node-RED flows that receive alerts from the Python AI script (e.g., via MQTT, HTTP POST, or a simple flag).
- Notification Dispatch: Configure Node-RED nodes to send real-time alerts:
- Telegram: Use the Telegram Bot API to send instant messages to a designated control room group.
- Email: Use SMTP nodes to send detailed email notifications to safety personnel.
- Firebase Integration: Implement Node-RED nodes or Python scripts to push alert data (timestamp, sensor values, alert type, image snapshot) to a Firebase Realtime Database or Firestore for secure, scalable cloud logging and historical analysis.
- Model Retraining & Continuous Improvement:
- Data Collection for Retraining: Continuously collect and store (e.g., on Firebase) instances of both true alarms and false positives/negatives experienced on-site. This "anomaly data" from the operational environment is crucial.
- Model Fine-tuning: Periodically use this collected on-site data to fine-tune the pre-trained fire detection model and gas detection logic. This adaptation process helps the AI system learn the unique characteristics of the specific industrial environment, improving accuracy and reducing false alarms over time.
- Over-the-Air (OTA) Updates: Implement a mechanism for safely deploying updated models or software to the Jetson Nano devices in the field.
Components & Tech Used:
- Edge AI Hardware: NVIDIA Jetson Nano Developer Kit (for powerful on-device AI processing).
- Sensors: MLX90640 Thermal Camera (for heat signature detection), MQ-135 Gas Sensor (for various hazardous gases).
- Image Processing & AI Frameworks: OpenCV (for image manipulation and pre-processing), TensorFlow Lite (for optimized on-device AI model inference).
- Edge Logic & Workflow Automation: Node-RED (visual programming tool for wiring hardware devices, APIs, and online services).
- Cloud Services: Firebase (Google's backend-as-a-service for real-time database, authentication, hosting, and cloud functions for alerts).
- Communication Protocols: MQTT (for efficient, lightweight messaging if integrating with broader IoT platforms).
- Alerting Channels: Telegram Bot API, Email (SMTP).
Benefits:
- AI-based Fire/Gas Alerts: Utilizes intelligent image classification and sensor analysis to provide highly accurate and contextualized alerts, significantly reducing false positives.
- Faster Response at the Edge: Performs AI inference directly on the Jetson Nano, enabling near-instantaneous detection and alert generation without reliance on constant cloud connectivity, crucial for time-sensitive safety incidents.
- Scalable Across Industries: The modular design and use of versatile components allow for easy deployment and adaptation across various industrial environments, including manufacturing plants, warehouses, chemical facilities, and smart buildings.
- Enhanced Safety & Asset Protection: Proactive detection minimizes risks to personnel and reduces potential damage to machinery and infrastructure.
- Data-Driven Insights: Cloud logging provides valuable data for post-incident analysis, trend identification, and continuous improvement of safety protocols.
- Reduced Operational Costs: Prevents costly damages, minimizes downtime, and optimizes emergency response efforts.
Project 2: Industrial Fire Detection Codes:
🔗 View Project Code on GitHub🧠 Notes:
· You can train or use an open-source fire detection TFLite model from datasets like FIRESENSE.
· Tune your gas_value and fire probability thresholds based on environment sensitivity.
· Firebase and Telegram credentials must be
· Inserted in their respective sections.

🚀 Ready to turn your IoT knowledge into a career-ready superpower?
At Huebits, we don’t just teach IoT—we train you to build, deploy, and dominate the industry with hands-on hardware experience, real-world projects, and cloud-integrated systems like AWS IoT, Grafana, and MQTT.
🛠️ Whether you're a student, engineer, or tech enthusiast, our Industry-Ready IoT Program is designed to make you future-proof. Learn edge computing, embedded systems, and AI-integrated automation—all in one power-packed journey.
🎓 Next Cohort starts soon!
🔗 Join Now to reserve your spot and take the first step into India’s ₹1.3 trillion IoT future.
3. ⚙️ Predictive Maintenance for CNC Machines

Overview: Unplanned downtime in CNC (Computer Numerical Control) machines can lead to significant production losses, missed deadlines, and hefty repair costs in manufacturing environments. This project introduces a cutting-edge AI-Powered Predictive Maintenance System specifically designed for CNC machinery. By continuously monitoring critical operational parameters like spindle temperature, vibration profiles, and motor current, this system leverages on-device machine learning to predict impending machine failures before they occur. The core intelligence resides in an ESP32 microcontroller embedded with an ML model trained to detect subtle anomalies in vibration patterns, which are often early indicators of mechanical wear or degradation. This proactive approach allows for scheduled maintenance, prevents catastrophic breakdowns, extends machine lifespan, and ensures uninterrupted production flow, significantly enhancing overall operational efficiency and profitability.
About the Project: This project focuses on building a highly efficient and intelligent predictive maintenance solution directly at the machine level (edge computing). It aims to transform traditional reactive or time-based maintenance into a smart, condition-based strategy for CNC machines.
The system relies on a crucial array of sensors that provide real-time operational data:
- Vibration Sensor: This is a primary indicator of machine health. Variations in vibration patterns (frequency, amplitude) can signal issues like bearing wear, imbalance, misalignment, or loose components within the spindle, motors, or other moving parts. The project specifically focuses on training an ML model on these vibration profiles to detect anomalies.
- Temperature Sensor (DS18B20): Used to monitor the temperature of critical components like the spindle bearing, motor housing, or gearboxes. Abnormal temperature increases often indicate excessive friction, lubrication issues, or impending mechanical failure. The DS18B20 is a robust digital temperature sensor suitable for industrial environments.
- Current Sensor (INA219): Monitors the current drawn by the CNC machine's motor (e.g., spindle motor, axis motors). Deviations from normal current draw can indicate increased load, friction, or electrical faults, providing another layer of diagnostic information. The INA219 is a high-side current/power monitor known for its precision.
The ESP32 microcontroller serves as the central processing unit at the edge. It's chosen for its Wi-Fi capabilities, processing power, and low power consumption, making it ideal for continuous monitoring in an industrial setting. A key innovation of this project is the deployment of a trained Machine Learning model directly onto the ESP32. Tools like Edge Impulse or TensorFlow Lite Micro are instrumental in facilitating this. These platforms allow developers to build, train, and deploy highly optimized ML models (e.g., anomaly detection, classification) that can run efficiently on resource-constrained microcontrollers.
The ML model, primarily trained on historical "healthy" and "anomalous" vibration data, continuously analyzes the incoming vibration stream from the CNC machine. When it detects a significant deviation from normal operating profiles – indicating a potential fault – it triggers an alert. This edge-based inference ensures real-time diagnostics with minimal latency, critical for preventing rapidly escalating failures.
Upon detecting an anomaly, the ESP32 is programmed to send immediate alerts via an MQTT broker. MQTT is a lightweight messaging protocol ideal for IoT, ensuring efficient and reliable communication. These alerts can be routed to a central control system, maintenance personnel via email/SMS, or logged for further analysis. All collected sensor data, including anomaly flags, is also pushed to a platform like Grafana for rich, interactive visualization. Grafana dashboards provide engineers with a comprehensive overview of machine health, historical trends, and specific fault indicators, enabling informed maintenance scheduling and proactive interventions.
Step-by-Step Procedure:
- Sensor Installation and Baseline Data Collection:
- Strategic Sensor Mounting: Carefully install the vibration sensor on the CNC machine's spindle housing, motor mounts, or other critical rotational components. Mount the DS18B20 temperature sensor on the spindle bearing housing, motor casing, or areas prone to heat build-up. Install the INA219 current sensor to monitor the motor's current draw (ensuring correct wiring for high-side current sensing).
- Connect to ESP32: Wire all sensors to the appropriate pins on the ESP32 microcontroller. Ensure stable power supply and pull-up resistors for digital sensors like DS18B20 if needed.
- Baseline Data Acquisition (7-10 days): Program the ESP32 to continuously collect raw sensor data (vibration readings, temperature, current) from the CNC machine during its normal, healthy operation for a period of 7-10 days (or longer, depending on machine usage patterns). This baseline data is crucial for training the anomaly detection model, representing the "normal" operational profile. Store this data locally (e.g., on an SD card attached to ESP32) or stream to a temporary cloud storage.
- ML Model Training for Anomaly Detection:
- Data Preprocessing for ML: Load the collected baseline data. For vibration data, extract relevant features in the time domain (e.g., RMS, peak-to-peak, crest factor) and frequency domain (e.g., using Fast Fourier Transform - FFT to identify dominant frequencies). Normalize or scale the sensor data.
- Select ML Platform: Choose an edge ML platform like Edge Impulse or manually prepare data for TensorFlow Lite Micro. Edge Impulse simplifies the entire process from data ingestion to model deployment.
- Model Training:
- Edge Impulse: Upload your baseline "healthy" data to Edge Impulse. Design an impulse (feature extraction + learning block). For anomaly detection, use algorithms like K-Means, Isolation Forest, or a neural network for novelty detection. Train the model on the "healthy" data.
- TensorFlow Lite Micro (Manual): If building manually, train a small neural network (e.g., an autoencoder for reconstruction error-based anomaly detection) or a classical ML model (e.g., One-Class SVM) on your processed "healthy" data using TensorFlow/Keras on a desktop, then convert it to a
.tflitemodel.
- Model Optimization: Optimize the trained model for size and inference speed to fit the ESP32's limited memory and processing power. Edge Impulse automates this with EON Compiler.
- Deploy Model on ESP32 for Real-time Diagnostics:
- Firmware Integration: Integrate the trained and optimized ML model (from Edge Impulse or TensorFlow Lite Micro) directly into the ESP32's firmware. Edge Impulse generates a deployable library (Arduino library, C++ library) that includes the model and necessary inference code.
- On-Device Inference: Program the ESP32 to continuously acquire real-time sensor data, process it (perform the same feature extraction as during training), and feed it to the embedded ML model for real-time anomaly detection inference.
- Anomaly Scoring: The model will output an anomaly score or a classification (normal/abnormal). Define a threshold for this score to trigger alerts.
- Alerting & Visualization:
- MQTT Broker Integration: Configure the ESP32 to connect to a local or cloud-based MQTT broker (e.g., Mosquitto, AWS IoT Core, HiveMQ).
- Alert Publishing: When the embedded ML model detects an anomaly (score exceeds threshold), program the ESP32 to publish an alert message (e.g., JSON payload with anomaly details, timestamp, sensor readings) to a specific MQTT topic (e.g.,
cnc/machine_id/alerts). - Grafana Dashboard Setup:
- Connect Grafana to a time-series database (e.g., InfluxDB, Prometheus, or a cloud service like AWS Timestream) that subscribes to the MQTT topic or receives data pushed from a cloud gateway.
- Design comprehensive dashboards in Grafana to visualize:
- Real-time sensor readings (vibration waveforms/features, temperature, current).
- Historical trends of these parameters.
- Anomaly scores from the ML model plotted over time.
- Alert logs and timestamps.
- Visual indicators for machine health status.
- Notification Configuration (Optional): Set up Grafana alerts or a cloud service (e.g., AWS SNS, email gateway) to send SMS/Email notifications to maintenance teams when specific anomaly conditions persist.
- Continuous Monitoring, Validation, and Refinement:
- On-Site Testing: Conduct rigorous testing of the deployed system on the CNC machine under various operational loads and conditions.
- False Positive/Negative Analysis: Collect feedback on triggered alerts (true faults vs. false alarms).
- Model Retraining: If false alarms are frequent or real faults are missed, collect more diverse "abnormal" data, label it, and use it to retrain or fine-tune the ML model. This iterative process of data collection and model update is crucial for long-term accuracy.
- Threshold Adjustment: Dynamically adjust anomaly thresholds based on observed machine behavior and desired sensitivity.
Components & Tech Used:
- Edge Hardware: ESP32 Microcontroller (or other suitable microcontrollers like ESP32-S3, Arduino Nano 33 BLE Sense).
- Sensors:
- Vibration Sensor (e.g., Analog Accelerometer like ADXL335, or a digital accelerometer like MPU6050 for more advanced data).
- Temperature Sensor (DS18B20 digital temperature sensor).
- Current Sensor (INA219 bi-directional current/power monitor).
- Edge ML Platforms: Edge Impulse (for streamlined ML development and deployment on edge devices), TensorFlow Lite Micro (for highly optimized ML inference on microcontrollers).
- Connectivity: Wi-Fi, MQTT protocol.
- Data Storage & Visualization: Grafana (for dashboards and analytics), alongside a time-series database (e.g., InfluxDB, Prometheus, or a cloud-based solution if data is pushed to cloud).
- Programming Languages/Tools: Arduino IDE/PlatformIO (for ESP32 firmware), Python (for data analysis, initial model training, and cloud integrations).
Benefits:
- Downtime Reduction: Predicts potential failures, allowing maintenance to be scheduled proactively during non-production hours, drastically cutting unplanned downtime.
- Early Detection of Mechanical Faults: Identifies subtle anomalies in vibration, temperature, and current before they escalate into major breakdowns, extending the lifespan of expensive CNC components.
- Embedded AI Model on Edge: Performs real-time diagnostics directly on the ESP32, ensuring low latency alerts and reducing reliance on continuous cloud connectivity.
- Optimized Maintenance Costs: Shifts from routine, calendar-based maintenance to condition-based maintenance, performing repairs only when necessary, saving on labor and parts.
- Enhanced Machine Lifespan: Proactive addressing of issues prevents compounding damage, leading to longer operational life for machinery.
- Increased Productivity: Maintains consistent production schedules by minimizing unexpected interruptions.
- Scalable Solution: The modular design allows for easy replication and deployment across multiple CNC machines or other industrial equipment.
Project 3: Predictive Maintenance for CNC Machines Codes:
🔗 View Project Code on GitHub📦 Components Setup
· INA219 Current Sensor: Connect via I2C (SDA, SCL).
· DS18B20 Temperature Sensor: Digital pin with 4.7kΩ pull-up.
· Vibration Sensor: Analog pin (e.g., A0 / GPIO34).
· Edge Impulse:
o Create a project → Upload vibration data → Label normal/anomaly
o Train → Deploy to “Arduino Library” → Add model .cpp & .h files
· Grafana: Use MQTT → Node-RED → InfluxDB → Grafana pipeline for dashboard.
4) 🛢️ Industrial Tank Level Monitoring System

Overview: Accurate and continuous monitoring of fluid levels in industrial tanks is critical for operational efficiency, safety, and inventory management. Manual level checks are prone to human error, time-consuming, and often impractical or hazardous. This project introduces a versatile IoT Industrial Tank Level Monitoring & Control System designed to provide real-time insights into fluid volumes within storage tanks, silos, or reservoirs. By strategically deploying a combination of ultrasonic sensors (for non-contact level measurement) and pressure sensors (for hydrostatic level determination), the system offers robust and redundant data acquisition. The data is securely transmitted by an ESP8266 microcontroller to a user-friendly platform like Blynk, enabling remote visualization of levels via a mobile app and dashboard. Crucially, the system supports automated alerts for abnormal thresholds and allows for remote control of pumps or valves, facilitating efficient inventory management, preventing costly spills or stockouts, and enhancing overall operational safety.
About the Project: This project provides a comprehensive solution for intelligent fluid management in industrial settings. It integrates multiple sensor technologies, a low-cost yet powerful microcontroller, and a cloud-based platform for seamless remote interaction.
The core of the data acquisition relies on two complementary sensor types:
- Ultrasonic Sensor (e.g., HC-SR04): This sensor is mounted at the top of the tank and measures the distance to the fluid surface using sound waves. It's a non-contact method, making it suitable for various fluid types and preventing sensor corrosion. Its primary output is distance, which is then converted to a level based on the tank's height.
- Pressure Sensor (e.g., Submersible Pressure Transducer): This sensor is typically placed at the base of the tank (or submerged in the fluid) and measures the hydrostatic pressure exerted by the fluid column above it. Pressure is directly proportional to the fluid height and density. This provides a robust alternative or redundant measurement, especially useful for opaque liquids or if the ultrasonic sensor encounters issues.
The ESP8266 microcontroller (or ESP32 for more GPIOs/power) serves as the brain of the edge device. It's chosen for its integrated Wi-Fi capabilities, making it ideal for connecting to the internet with minimal external components. The ESP8266 will:
- Read data from both the ultrasonic and pressure sensors.
- Perform initial data processing and conversion (e.g., converting distance to fluid level, pressure to fluid height).
- Connect to the Wi-Fi network.
- Securely send the real-time level data to the Blynk IoT platform.
Blynk is utilized as the application layer, providing an incredibly fast and intuitive way to build mobile and web dashboards for IoT projects. Through Blynk, users can:
- Visualize real-time tank levels using customizable widgets (gauges, graphs).
- Receive instant alerts (push notifications, email, SMS) when fluid levels drop below a critical low threshold or exceed a high threshold, preventing overfilling or running dry.
- Critically, remotely control pumps or valves connected to the ESP8266 via virtual buttons or sliders on the Blynk app. This enables automated refilling or draining processes, enhancing operational efficiency and reducing manual intervention.
For long-term data storage and more advanced analytics beyond Blynk's built-in history, the system can also log historical data to a more robust database like ThingsBoard (an open-source IoT platform offering advanced dashboards and rules) or Firebase (Google's NoSQL cloud database). This allows for trend analysis, capacity planning, and compliance reporting.
Step-by-Step Procedure:
- Sensor Mounting & Physical Connection:
- Ultrasonic Sensor Mounting: Securely mount the HC-SR04 ultrasonic sensor facing downwards on the top interior surface of the industrial tank, ensuring a clear, unobstructed path to the fluid surface. Avoid mounting directly over mixers or inlets that could cause turbulence.
- Pressure Sensor Mounting: Install the pressure sensor at the very bottom of the tank, or ensure it's fully submerged if it's a submersible type. Connect its output to the ESP8266's analog input pin (ADC). For some industrial pressure sensors, an external signal conditioner might be needed to adapt the output to the ESP8266's input range.
- Wiring to ESP8266: Connect the VCC, GND, Trigger (Trig), and Echo (Echo) pins of the HC-SR04 to appropriate digital GPIOs on the ESP8266. Connect the VCC, GND, and Signal Out of the pressure sensor to the ESP8266, typically to an analog input (ADC) if it's an analog sensor. Ensure a stable 3.3V or 5V power supply for all components.
- ESP8266 Programming & Calibration:
- Arduino IDE/PlatformIO Setup: Configure your development environment for the ESP8266 board.
- Sensor Data Reading: Write firmware to read distance from the ultrasonic sensor (sending a pulse via Trig and measuring echo time via Echo) and analog voltage from the pressure sensor.
- Sensor Calibration:
- Tank Dimensions: Measure the exact height of the tank.
- Ultrasonic Calibration: With the tank empty, measure the distance from the sensor to the tank bottom. When full, measure the distance to the fluid. Use these values to convert sensor distance readings into a fluid level percentage or volume.
- Pressure Sensor Calibration: Calibrate the pressure sensor by relating its output voltage to known fluid heights (e.g., empty tank, half-full, full). Account for the fluid's density if using the pressure sensor for volume calculation.
- Wi-Fi Connectivity: Program the ESP8266 to connect to your local Wi-Fi network (SSID and password).
- Blynk Library Integration: Include the Blynk library in your code. Obtain an Auth Token from your Blynk project and embed it in your ESP8266 sketch.
- Blynk Dashboard & Virtual Pin Configuration:
- Blynk Project Creation: Create a new project in the Blynk mobile app or web dashboard.
- Add Widgets: Add appropriate widgets to your dashboard:
- Gauge/Level Widget: For real-time fluid level display (e.g., connected to Virtual Pin V1).
- History Graph: To plot historical level data over time (e.g., connected to Virtual Pin V1).
- Button/Slider Widget: For remote control of a pump or valve (e.g., connected to Virtual Pin V2).
- Virtual Pin Mapping: In your ESP8266 code, use
Blynk.virtualWrite(V1, fluidLevel);to send data to the gauge/graph, andBlynk.virtualRead(V2)in a function to receive commands from the button/slider. - Blynk Automations/Alerts: Configure automations directly in the Blynk app to send push notifications, emails, or SMS alerts when the
fluidLevel(on V1) goes below a critical low threshold or above a critical high threshold.
- Remote Control Logic Implementation:
- Actuator Connection: Connect a relay module to an ESP8266 digital output pin. This relay will control the external pump or valve (ensure appropriate voltage and current ratings for the pump/valve and relay).
- Control Logic: In your ESP8266 firmware, write code within a
Blynk.virtualWrite(V2)handler to toggle the relay (and thus the pump/valve) based on the state received from the Blynk app's button/slider. Implement safety interlocks (e.g., preventing pump activation if level is already full).
- Historical Data Logging (Optional, for advanced analytics):
- ThingsBoard/Firebase Setup: Set up an account and a new device/project in ThingsBoard or Firebase.
- Data Forwarding: In your ESP8266 code, or via a simple Python script running on a server, forward the sensor data from Blynk's stream or directly from the ESP8266 (if not exclusively using Blynk) to ThingsBoard/Firebase. This typically involves sending HTTP POST requests or using their respective SDKs/APIs.
- Advanced Dashboards: Create more complex analytical dashboards in ThingsBoard/Firebase that can perform aggregate analysis, long-term trend forecasting, or integrate with other business intelligence tools.
- System Testing and Refinement:
- Connectivity Test: Verify stable Wi-Fi and Blynk cloud connection.
- Sensor Accuracy: Cross-verify sensor readings with manual measurements at different fluid levels.
- Alerting Test: Trigger low/high level conditions to ensure alerts are sent promptly.
- Control Test: Verify remote control of pump/valve from the Blynk app.
- Data Logging Test: Confirm that historical data is being logged correctly to ThingsBoard/Firebase.
- Robustness: Test the system's resilience to network interruptions or power fluctuations. Continuously refine calibration, thresholds, and control logic based on real-world performance.
Components & Tech Used:
- Microcontroller: ESP8266 NodeMCU/Wemos D1 Mini (affordable, Wi-Fi enabled).
- Sensors: HC-SR04 Ultrasonic Sensor (for non-contact level measurement), Pressure Sensor (e.g., a submersible water level sensor or a general pressure transducer suitable for liquid-filled tanks).
- IoT Platform: Blynk (for rapid mobile app development, dashboarding, and remote control).
- Data Logging (Optional for long-term/advanced analytics): Firebase (Google's cloud NoSQL database) or ThingsBoard (open-source IoT platform).
- Actuator Control: Relay Module (to switch higher voltage/current pumps/valves).
- Programming Language/IDE: Arduino IDE (for ESP8266 firmware).
Benefits:
- Remote Tank Monitoring: Provides 24/7 access to critical fluid level data from anywhere, eliminating the need for manual, potentially hazardous checks.
- Leak Detection and Auto-Refill: Early detection of sudden level drops (potential leaks) and automated pump/valve control for efficient refilling or draining, preventing costly operational disruptions.
- App-Based Controls: Intuitive mobile app interface for visualizing data, setting alerts, and controlling connected actuators, enhancing user convenience and responsiveness.
- Improved Inventory Management: Accurate level data aids in precise inventory tracking, reducing stockouts and optimizing procurement.
- Enhanced Safety: Minimizes human exposure to hazardous tank environments and prevents dangerous overfilling or catastrophic spills.
- Data-Driven Decisions: Historical data logging enables trend analysis, capacity planning, and predictive insights into consumption patterns.
Project 4: Industrial Tank Level Monitoring System Codes:
🔗 View Project Code on GitHub⚙️ Project: Smart Industrial Tank Level Monitor
🧠 Features:
· Real-time fluid level monitoring (via HC-SR04 + pressure sensor)
· Low/High level alerts on Blynk app
· Remote pump/valve control
· Data logging to Firebase (optional)
· Leak detection logic
🔧 Hardware Connections:
|
Component |
ESP8266 Pin |
|
HC-SR04 TRIG |
D5 (GPIO14) |
|
HC-SR04 ECHO |
D6 (GPIO12) |
|
Pressure Sensor |
A0 |
|
Relay Module |
D7 (GPIO13) |
📲 Setup:
1. Create a Blynk project
2. Add:
o Value Display (V1): Water Level %
o LED Widget (V2): Leak Alert
o Button Widget (V3): Manual Pump Control (Relay)
3. Get Auth Token from Blynk email
📦 Firebase (Optional Add-on):
You can log level, pressure, and timestamp to Firebase using the FirebaseESP8266 library. Let me know if you want Firebase code integrated into this as well.
🔥 Benefits Recap:
· Fully remote, app-controlled tank system
· Auto motor control based on thresholds
· Leak detection logic
· Firebase/ThingsBoard ready for analytics
📌 Make sure you install the FirebaseESP8266 library and replace placeholders (YOUR_WIFI_SSID, FIREBASE_HOST, etc.) with your actual credentials
5. 🔄 Conveyor Belt Health Monitoring with ML

Overview: Conveyor belts are the circulatory system of modern warehouses, manufacturing plants, and logistics hubs. Any unexpected downtime due to mechanical failure can halt operations, leading to significant financial losses and operational delays. This project introduces an innovative Acoustic & Vibration Anomaly Detection System for conveyor belts, designed to prevent costly breakdowns through intelligent predictive maintenance. By continuously analyzing the subtle acoustic signals (sounds) and vibration patterns emanating from the conveyor system, this solution leverages on-device Machine Learning (ML) to identify early indicators of mechanical faults such as motor misalignment, bearing wear, or belt damage. This edge-based AI processing enables real-time alerts without reliance on constant internet connectivity, ensuring immediate detection and allowing maintenance teams to intervene proactively, transforming reactive repairs into scheduled, efficient interventions.
About the Project: This project focuses on implementing a highly efficient and intelligent monitoring system directly at the source of potential failures – the conveyor belt itself. It employs a non-invasive approach using sound and motion to detect subtle signs of degradation long before they lead to catastrophic failure.
The system's core sensory inputs come from:
- MEMS Microphones (Acoustic Signals): Microphones are strategically placed to capture the ambient sounds of the conveyor belt. Anomalies in these acoustic signatures, such as grinding noises, unusual hums, squeaks, or sudden changes in sound patterns, can indicate issues like dry bearings, belt rubbing, motor problems, or roller wear.
- Vibration Sensors (Accelerometers): These sensors are mounted on key components like motors, idler rollers, and tensioning mechanisms. They measure vibrations across multiple axes. Abnormal vibration patterns (e.g., changes in frequency, amplitude, or spectral content) are tell-tale signs of imbalances, misalignments, loose components, bearing defects, or even belt tears.
The Arduino Nano 33 BLE Sense is the perfect choice for the edge device in this project. It's a compact, low-power microcontroller featuring built-in MEMS accelerometer (for vibration) and a MEMS microphone (for acoustic sensing). Crucially, it has an onboard Neural Network (NN) core, making it highly suitable for running lightweight Machine Learning models directly on the device. Its Bluetooth Low Energy (BLE) and optional Wi-Fi capabilities provide flexible options for data transmission.
The heart of the intelligence lies in Edge Impulse. This powerful platform simplifies the entire workflow for deploying ML on edge devices:
- Data Collection: Edge Impulse provides tools to easily collect raw acoustic and vibration data from the Arduino Nano 33 BLE Sense. Crucially, this involves collecting data for both "normal" operational states and various "faulty" states (e.g., simulated bearing wear, belt slippage, motor imbalance).
- Feature Extraction: Raw sensor data (audio waveforms, accelerometer readings) is transformed into meaningful features that the ML model can learn from. For acoustic data, this often involves Mel-Frequency Cepstral Coefficients (MFCCs) or spectrograms. For vibration, it can involve statistical features (RMS, peak-to-peak) or frequency-domain features (FFT).
- Model Training & Optimization: Anomaly detection or classification models (e.g., TinyML neural networks, SVMs, decision trees) are trained on the processed features within Edge Impulse. The platform then optimizes these models for the specific hardware constraints of the Arduino Nano 33 BLE Sense, ensuring efficient inference.
- On-Device Classification: The trained model is then deployed onto the Arduino Nano 33 BLE Sense. In real-time, the Arduino continuously captures acoustic and vibration data, performs the same feature extraction, and feeds it into the embedded ML model. The model then classifies the incoming data as "normal" or flags it as a specific "anomaly type" (e.g., "bearing wear," "motor misalignment," "belt squeal").
When an anomaly is detected on-device, the Arduino Nano 33 BLE Sense can trigger immediate local alerts (e.g., an LED indicator, a small buzzer) and send the anomaly details via Bluetooth Low Energy (BLE) to a nearby gateway (e.g., a Raspberry Pi) or a mobile device. For longer-range communication or cloud integration, data can be transmitted via Wi-Fi (if configured on the Nano 33 BLE Sense, perhaps through a connected ESP32 as a Wi-Fi bridge, or by using a Nano RP2040 Connect). This information can then be visualized and logged in a local dashboard (for on-premise monitoring) or pushed to a cloud platform for long-term storage and historical analysis.
Step-by-Step Procedure:
- Sensor Installation and Initial Setup:
- Strategic Sensor Mounting:
- Microphones: Mount MEMS microphones along the conveyor belt system, particularly near motors, gearboxes, rollers, and belt joints, ensuring they are protected from excessive dust or direct physical impact.
- Vibration Sensors: Securely attach vibration sensors (accelerometers) directly onto the housings of motors, critical bearings, idler rollers, and areas where belt tension changes.
- Arduino Nano 33 BLE Sense Setup: Power the Arduino Nano 33 BLE Sense. Ensure it's connected to your development environment (Arduino IDE or PlatformIO).
- Strategic Sensor Mounting:
- Data Collection and Baseline Establishment (using Edge Impulse):
- Edge Impulse Project Setup: Create a new project in Edge Impulse and select the Arduino Nano 33 BLE Sense as your device.
- Connect Device: Follow Edge Impulse's instructions to connect your Arduino Nano 33 BLE Sense to the Edge Impulse studio (usually via a serial connection through your computer).
- Collect "Normal" Data: Run the conveyor belt under various normal operating conditions (e.g., empty belt, partially loaded, full load). Use Edge Impulse's data acquisition tab to record acoustic and vibration data samples for each condition. Label these samples as "normal." Collect a significant amount of data to represent all healthy states.
- Collect "Faulty" Data: Crucially, collect data for various simulated or known fault conditions. This might involve intentionally inducing minor misalignments, creating artificial friction (e.g., for belt wear), or using known faulty components. Label these samples with specific fault types (e.g., "bearing_wear," "motor_misalignment," "belt_squeal"). If direct fault simulation is not possible, focus on anomaly detection on "normal" data.
- ML Model Training (within Edge Impulse):
- Impulse Design: In Edge Impulse, create an "Impulse."
- Preprocessing Blocks: Add "Audio (MFE)" for acoustic data and "Accelerometer" for vibration data. These blocks will extract features from your raw sensor data (e.g., MFCCs for audio, statistical features or FFT for accelerometer).
- Learning Block: Add a "Classification (Keras)" or "Anomaly Detection" learning block. For classifying specific fault types, use Classification. For detecting any deviation from normal, use Anomaly Detection.
- Model Training: Train the chosen ML model. Edge Impulse automatically handles hyperparameter tuning and optimization for the target device. Evaluate the model's accuracy on the test data.
- Impulse Design: In Edge Impulse, create an "Impulse."
- Deploy Model On-Device for Real-time Diagnostics:
- Deployment: In Edge Impulse, go to the "Deployment" tab. Select "Arduino Library" (or "C++ Library") and click "Build." This generates a
.zipfile containing your optimized ML model and all necessary inference code. - Flash Firmware: Import the generated library into your Arduino IDE or PlatformIO project. Write a new Arduino sketch that continuously reads data from the onboard microphone and accelerometer, processes it using the embedded ML model, and performs inference.
- On-Device Classification: The sketch will classify incoming data as "normal" or identify the specific anomaly type in real-time, directly on the Arduino Nano 33 BLE Sense.
- Deployment: In Edge Impulse, go to the "Deployment" tab. Select "Arduino Library" (or "C++ Library") and click "Build." This generates a
- Alerting & Visualization:
- Local Alerts: Program the Arduino Nano 33 BLE Sense to trigger local alerts (e.g., blinking an onboard LED, activating a small buzzer) when an anomaly is detected.
- Data Transmission (BLE/Wi-Fi):
- BLE: Use the Arduino's built-in BLE capabilities to send compact alert messages (e.g., anomaly type, confidence score, timestamp) to a nearby BLE-enabled gateway (e.g., Raspberry Pi) or a mobile app.
- Wi-Fi (via bridge or separate module): If longer range or direct cloud integration is needed, the Arduino can send data to a Wi-Fi module (like an ESP32 acting as a bridge) or, if using an Arduino Nano RP2040 Connect, directly to Wi-Fi.
- Dashboarding:
- Local Dashboard: For a local setup, the gateway (e.g., Raspberry Pi) can run a web server (e.g., Flask) with a simple dashboard using Python libraries like Plotly or Matplotlib, or use Node-RED.
- Cloud Dashboard: Push anomaly data to a cloud platform (e.g., AWS IoT Core, Google Cloud IoT Core, Firebase) and visualize it using dashboards like Grafana, Google Data Studio, or custom web UIs. Log all anomaly events for historical tracking and analysis.
- Continuous Monitoring, Testing, and Refinement:
- Real-world Testing: Deploy the system on a live conveyor belt and monitor its performance.
- False Positive/Negative Analysis: Collect feedback on triggered alerts. Are true faults being detected? Are false alarms minimized?
- Model Retraining: As new types of faults emerge or as the system ages, collect new data (especially for conditions that trigger false alarms or are missed) and use it to retrain and fine-tune the Edge Impulse model. This iterative process is crucial for maintaining high accuracy.
- Threshold Adjustment: If using anomaly detection, adjust the anomaly threshold to balance sensitivity and false alarms.
Components & Tech Used:
- Microcontroller: Arduino Nano 33 BLE Sense (ideal for onboard sensors and edge ML inference).
- Sensors:
- Vibration Sensor (onboard MEMS Accelerometer of Nano 33 BLE Sense).
- MEMS Microphone (onboard of Nano 33 BLE Sense).
- Edge ML Platform: Edge Impulse (for data collection, feature engineering, model training, and deployment).
- Connectivity: Bluetooth Low Energy (BLE) for local communication, potentially Wi-Fi for cloud integration (via external module or different Arduino board).
- Dashboarding & Logging: Local dashboard (e.g., Flask + Plotly on Raspberry Pi) or Cloud-based solutions (e.g., Grafana + InfluxDB, Firebase, AWS IoT Analytics).
- Programming Language/IDE: Arduino IDE (for firmware development).
Benefits:
- Detect Motor Misalignment or Belt Wear: Provides specific insights into common mechanical faults through detailed analysis of acoustic and vibration signatures.
- Real-time Alerts without Internet Dependency: Edge-based AI allows for immediate fault detection and local alerts, crucial for safety-critical systems where continuous internet connectivity might be unreliable or costly.
- Predictive Maintenance on Edge: Enables proactive scheduling of maintenance, minimizing unplanned downtime, reducing repair costs, and extending the lifespan of expensive conveyor belt components.
- Reduced Manual Inspections: Automates a significant portion of routine monitoring, freeing up human resources.
- Data-Driven Optimization: Historical data on anomalies can be used to optimize maintenance schedules, identify weak points in the conveyor design, and improve overall operational efficiency.
Project 5: Conveyor Belt Health Monitoring with ML Codes:
🔗 View Project Code on GitHub🧰 Hardware Components
· Arduino Nano 33 BLE Sense: Equipped with a digital MEMS microphone and 9-axis IMU.
· Optional External Sensors:
o Vibration Sensor: For enhanced vibration data.
o MEMS Microphone: For improved acoustic signal capture.
· Connectivity Modules:
o BLE Module: For wireless data transmission.
o Wi-Fi Module: For cloud integration.
🧠 Step-by-Step Implementation
1. Sensor Installation
· Microphones: Place near motor housings or belt rollers to capture acoustic signatures.
· Vibration Sensors: Mount on structural elements of the conveyor to detect mechanical anomalies.
2. Data Acquisition with Edge Impulse
· Setup:
o Install the Edge Impulse CLI and connect your Arduino Nano 33 BLE Sense.
o Use the edge-impulse-daemon to stream data to Edge Impulse Studio.mjrovai.github.io
· Data Collection:
o Record samples during normal operation and during known fault conditions (e.g., misalignments, wear).
o Ensure a balanced dataset for effective training.
3. Model Training
· Signal Processing:
o Apply spectral analysis to both audio and vibration data to extract meaningful features.
· Learning Blocks:
o Classification Block: Distinguishes between normal and faulty states.
o Anomaly Detection Block: Identifies deviations from learned normal patterns.
· Model Evaluation:
o Use Edge Impulse's built-in tools to assess model accuracy and performance.
4. Model Deployment
· Export:
o Download the trained model as an Arduino library from Edge Impulse.forum.edgeimpulse.com+4docs.edgeimpulse.com+4youtube.com+4
· Integration:
o Include the library in your Arduino IDE and upload the firmware to the Nano 33 BLE Sense.
5. Real-Time Inference and Alerting
· Inference Loop:
o Continuously read sensor data and run inference using the deployed model.
o Trigger alerts when anomalies are detected.
· Communication:
o Send alerts via BLE or Wi-Fi to a central monitoring system or dashboard.
📊 Visualization and Logging
· Local Dashboard:
o Use tools like Grafana to visualize real-time data and anomalies.
· Cloud Integration:
o Send data to cloud platforms (e.g., AWS IoT, Azure IoT) for centralized monitoring and advanced analytics.
🧪 Testing and Validation
· Simulate Faults:
o Introduce known issues (e.g., misalignments, added friction) to test the system's detection capabilities.
· Performance Metrics:
o Evaluate the system's accuracy, precision, recall, and response time.docs.arduino.cc+1tinyml.seas.harvard.edu+1
📚 Additional Resources
· Edge Impulse Documentation: Comprehensive guides on data collection, model training, and deployment.
· Arduino Nano 33 BLE Sense Datasheet: Detailed specifications and sensor information.
🚀 Ready to turn your IoT knowledge into a career-ready superpower?
At Huebits, we don’t just teach IoT—we train you to build, deploy, and dominate the industry with hands-on hardware experience, real-world projects, and cloud-integrated systems like AWS IoT, Grafana, and MQTT.
🛠️ Whether you're a student, engineer, or tech enthusiast, our Industry-Ready IoT Program is designed to make you future-proof. Learn edge computing, embedded systems, and AI-integrated automation—all in one power-packed journey.
🎓 Next Cohort starts soon!
🔗 Join Now to reserve your spot and take the first step into India’s ₹1.3 trillion IoT future.
6. 🔒 Smart Industrial Access Control System
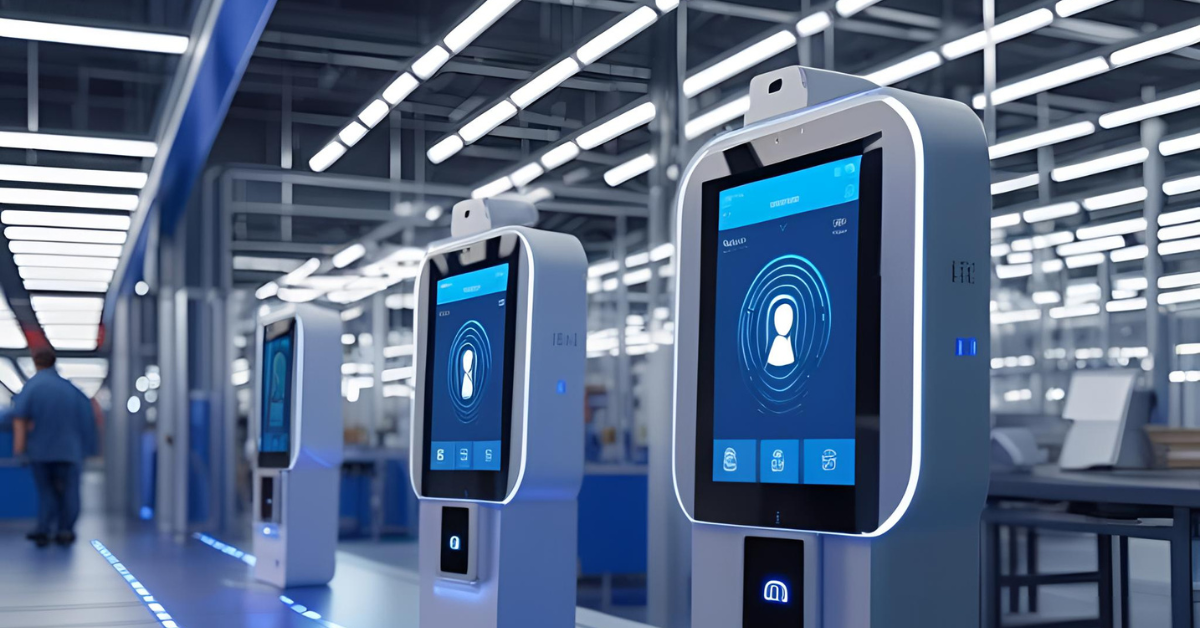
Overview: Traditional key-based access control systems in industrial environments often lack real-time oversight, audit trails, and the flexibility needed for modern security management. This project introduces a robust Smart Industrial Access Control System that replaces outdated mechanisms with a secure, RFID-based solution integrated with powerful cloud monitoring. At its core, an ESP32 microcontroller acts as the intelligent gateway, securely connecting an RFID scanner to a centralized cloud platform. This system enables precise, role-based access control for industrial doors, machinery, or restricted zones, granting entry only to authorized personnel upon successful RFID tag authentication. All access attempts, both successful and unauthorized, are logged in real-time to Firebase, providing a comprehensive audit trail and instant alerts to security personnel. This solution significantly enhances facility security, streamlines access management, and provides invaluable data for compliance and operational insights.
About the Project: This project focuses on developing a modern, secure, and scalable access control system tailored for industrial or enterprise settings where precise control over entry points is critical. It combines affordable edge hardware with powerful cloud services to create a comprehensive security solution.
The system's local intelligence and primary interface are handled by the ESP32 microcontroller:
- RFID Scanner (RC522): The RC522 module is a popular and cost-effective RFID reader/writer that communicates with the ESP32. It continuously scans for RFID tags (e.g., employee ID cards, key fobs). When a tag is presented, the RC522 reads its unique ID.
- Door Latch Control (Servo Motor/Solenoid): Upon successful authentication, the ESP32 controls an electronic door latch. While a servo motor can be used for simple locking/unlocking mechanisms, for industrial-grade doors, a solenoid lock or an electric strike controlled by a relay would be more robust and suitable for heavy-duty usage. The ESP32 sends a signal to actuate this latch.
- Visual/Auditory Feedback: A buzzer provides immediate feedback for access granted/denied, and an LED can visually indicate the status.
The power of this system lies in its cloud integration with Firebase:
- Real-time Database: Firebase's Realtime Database or Firestore serves as the central repository for registered employee RFID tags and their assigned access roles. This allows for dynamic updates to access permissions without needing to re-flash the ESP32.
- Access Logging: Every access attempt (successful, denied due to invalid tag, or denied due to unauthorized access role) is logged with a timestamp and the RFID tag ID. This creates an indispensable audit trail for security compliance and incident investigation.
- Google Cloud Functions: These serverless functions act as the bridge between the ESP32's data and advanced cloud logic. They can be triggered by new data in Firebase (e.g., an unauthorized access attempt) to:
- Send push notifications to security personnel's mobile devices.
- Trigger email alerts with detailed incident information.
- Potentially interface with other security systems or play louder alarms in a control room.
- Web Interface for Management: A simple web interface, potentially built directly using Firebase Hosting and its client-side SDKs, allows administrators to easily manage registered RFID tags, assign/revoke access roles, view real-time access logs, and generate reports.
This system provides a significant upgrade over traditional physical keys or standalone access control panels by offering real-time monitoring, centralized management, detailed audit capabilities, and rapid response to security events.
Step-by-Step Procedure:
- Hardware Assembly and Basic Connectivity:
- Connect RC522 RFID Module: Wire the RC522 RFID module to the ESP32 microcontroller using SPI communication (typically involves connecting MOSI, MISO, SCK, SDA/SS, and RST pins).
- Connect Door Actuator: Connect a servo motor (for light duty) or a relay module (for controlling a solenoid lock or electric strike, which is more common in industrial settings) to an appropriate digital output pin on the ESP32. Ensure proper power supply for the actuator.
- Connect Feedback Components: Add a small buzzer and an LED to ESP32 digital pins for immediate audio-visual feedback (e.g., green for access granted, red for denied).
- Firebase Project Setup and Database Structure:
- Create Firebase Project: Go to the Firebase Console and create a new project.
- Choose Database: Select either Firestore (recommended for structured data and scalability) or Realtime Database.
- Database Structure Design:
- Create a collection/path for
authorized_tags:{"tag_id": "UNIQUE_RFID_HEX", "role": "admin/employee", "name": "John Doe", "access_level": 1} - Create a collection/path for
access_logs:{"tag_id": "UNIQUE_RFID_HEX", "timestamp": "...", "status": "granted/denied", "reason": "unauthorized/invalid_tag"}
- Create a collection/path for
- Authentication (Optional but Recommended): Set up Firebase Authentication (e.g., Email/Password) for web interface administrators.
- Security Rules: Configure Firebase security rules to allow read/write access to
authorized_tagsonly by authenticated administrators, and append-only write access toaccess_logsfrom the ESP32 (if using a less secure direct connection, or more securely, via a Cloud Function).
- ESP32 Firmware Development:
- Arduino IDE/PlatformIO Setup: Configure your development environment for ESP32.
- Libraries: Install necessary libraries for RC522 (e.g., MFRC522), Wi-Fi, and Firebase (e.g., Firebase Arduino ESP32 Client library).
- Wi-Fi Connectivity: Program the ESP32 to connect to the local Wi-Fi network.
- RFID Reading Logic: Write code to initialize the RC522, continuously scan for RFID tags, and read their unique IDs.
- Firebase Integration: Implement logic to:
- Read the
authorized_tagslist from Firebase on startup or periodically. - Compare the scanned RFID tag ID against the authorized list.
- Control the servo/relay to unlock the door if authorized.
- Write access log entries (tag ID, timestamp, status) to the
access_logscollection in Firebase for every attempt.
- Read the
- Google Cloud Functions for Advanced Logic & Alerts:
- Setup: Initialize Firebase CLI in your development environment and create a
functionsdirectory. - Function for Access Control (Optional but Recommended for Security): Instead of direct ESP32-to-Firebase authorization, use a Cloud Function that the ESP32 calls with the scanned tag ID. This function verifies access against Firebase and then sends a response back to the ESP32 to open/deny. This centralizes logic and keeps Firebase credentials off the edge device.
- Function for Alerts: Create a Google Cloud Function (triggered by a new entry in the
access_logscollection, specifically for "denied" or "unauthorized" status) that:- Composes a detailed alert message.
- Sends push notifications (e.g., via FCM - Firebase Cloud Messaging) to registered security devices.
- Sends email alerts using an email service (e.g., SendGrid, Mailgun, or directly via NodeMailer from the function) to security personnel.
- (Optional) Integrates with a local buzzer/alarm system via another endpoint.
- Setup: Initialize Firebase CLI in your development environment and create a
- Web Interface Development (for Administration):
- Firebase Hosting: Use Firebase Hosting to deploy a simple web application.
- HTML/CSS/JavaScript: Build the frontend using standard web technologies.
- Firebase SDKs: Integrate Firebase client-side SDKs (Authentication, Firestore/Realtime Database) to allow administrators to:
- Login securely.
- View the
access_logsin real-time. - Add/remove/update RFID tags and their access roles in the
authorized_tagscollection. - Search/filter access logs.
- System Testing and Deployment:
- Unit Testing: Test each component: RFID reading, servo/relay control, Firebase read/write from ESP32, Cloud Function triggers, and web interface functionality.
- Integrated Testing: Deploy the complete system. Test with authorized and unauthorized RFID tags, ensuring correct door actuation, log entries, and alert notifications.
- Security Testing: Verify access control rules, ensure sensitive data is protected, and test for potential vulnerabilities.
- Final Deployment: Deploy the ESP32 firmware, Google Cloud Functions, and Firebase web interface.
Components & Tech Used:
- Microcontroller: ESP32 (Wi-Fi and Bluetooth capabilities).
- RFID Module: RC522 RFID Reader/Writer.
- Door Actuator: Servo Motor (for light doors/mechanisms) or Relay Module + Solenoid Lock/Electric Strike (for industrial use).
- Cloud Platform: Firebase (Realtime Database/Firestore for data storage, Hosting for web UI, Authentication), Google Cloud Functions (for serverless backend logic, triggering alerts).
- Communication: Wi-Fi, SPI (for RC522), MQTT (optional, for broader IoT integration).
- Alerting: Firebase Cloud Messaging (FCM) for push notifications, Email service (e.g., SendGrid, NodeMailer).
- Feedback: LED, Buzzer.
- Programming Languages/Tools: Arduino IDE/PlatformIO (for ESP32), JavaScript/Node.js (for Google Cloud Functions), HTML/CSS/JavaScript (for web interface).
Benefits:
- Real-time Access Logging: Provides an instant and immutable record of every access attempt, greatly simplifying security audits and forensic investigations.
- Cloud-based Entry Control: Centralized management of access permissions from anywhere, allowing for immediate revocation or granting of access without physical presence at the door.
- Role-Based Access Security: Implement granular control, ensuring that personnel only access areas relevant to their assigned roles, enhancing overall security posture.
- Enhanced Security: Minimizes risks associated with lost keys, unauthorized key duplication, and provides immediate alerts for attempted breaches.
- Streamlined Operations: Automates access processes, reducing manual oversight and potential human error.
- Scalability: Easily extendable to multiple doors and locations by adding more ESP32 units connected to the same Firebase project.
Project 6: Smart Industrial Access Control System Codes:
🔗 View Project Code on GitHubKey Outcomes of the Smart Industrial Access Control System:
- Enhanced Security Posture: By replacing traditional, vulnerable locks with a robust, cloud-integrated RFID system, the project achieves a significantly higher level of security, reducing the risk of unauthorized access and physical breaches in industrial zones.
- Real-time Situational Awareness: The system provides immediate visibility into all access attempts, allowing security personnel to monitor who entered where and when, in real-time. This includes instant alerts for any unauthorized entry attempts, enabling rapid response.
- Comprehensive Audit Trails: Every entry and denial is meticulously logged with timestamps and RFID tag IDs in the cloud. This creates an immutable, easily accessible audit trail crucial for compliance, incident investigation, and security policy enforcement.
- Streamlined Access Management: Centralized, cloud-based management of RFID tags and access roles allows for quick and efficient granting or revoking of permissions remotely. This reduces administrative overhead compared to managing physical keys or local access systems.
- Reduced Human Error & Manual Processes: Automation of access control eliminates manual logging and physical key management, significantly reducing human error and freeing up personnel for more critical tasks.
- Improved Operational Efficiency & Safety: By controlling access to specific machinery or hazardous zones based on roles, the system enhances operational safety by ensuring only qualified personnel can operate certain equipment or enter restricted areas.
- Data-Driven Insights for Security Optimization: The accumulated access log data can be analyzed to identify patterns, peak access times, or potential vulnerabilities, informing data-driven decisions to further optimize security protocols and resource allocation.
- Scalability and Flexibility: The modular design (ESP32 units) and cloud-based backend (Firebase, Cloud Functions) ensure the system can be easily scaled to monitor and control numerous access points across multiple facilities without a major overhaul.
7. 📦 Industrial Package Integrity Detection

Overview: In the complex world of industrial logistics and supply chain management, ensuring the integrity of parcels during transit is paramount, especially for high-value goods, sensitive materials, or cold chain products. Traditional methods often provide limited visibility into a package's journey, making it difficult to pinpoint tampering, mishandling, or exposure to adverse environmental conditions. This project introduces a state-of-the-art Smart Parcel Integrity Monitoring System that addresses these critical challenges. By embedding discreet weight (load cell), temperature, and humidity (DHT11) sensors directly inside a specialized packaging unit, the system continuously tracks key parameters. An ESP8266 microcontroller processes this data in real-time, intelligently detecting anomalies such as a sudden weight drop (indicating content removal), unauthorized motion/impacts, or deviations from specified environmental thresholds. This enables proactive alerts to stakeholders, providing invaluable data for accountability, reducing losses from theft or spoilage, and ensuring compliance with handling requirements throughout the supply chain.
About the Project: This project focuses on building a "smart" packaging unit that continuously self-monitors its internal conditions and integrity throughout its logistical journey. It's designed to provide unprecedented transparency and control over parcel safety.
The core of the system relies on a combination of embedded sensors and a compact, Wi-Fi-enabled microcontroller:
- Load Cell (with HX711 Amplifier): A mini load cell is carefully integrated into the base of the packaging unit. This sensor, paired with the HX711 high-precision 24-bit analog-to-digital converter, accurately measures the weight of the parcel's contents. Any significant deviation from the initial, calibrated weight (e.g., a sudden drop) instantly signals potential tampering, theft of contents, or accidental loss of items. The HX711 is crucial for converting the load cell's tiny analog resistance changes into a readable digital signal for the microcontroller.
- Temperature & Humidity Sensor (DHT11): The DHT11 sensor is placed inside the package to monitor ambient temperature and relative humidity. This is vital for sensitive goods such as pharmaceuticals, electronics, food products, or chemicals that require specific environmental conditions. Breaches of pre-defined temperature or humidity thresholds (e.g., a cold chain violation, exposure to excessive moisture) can indicate potential damage or spoilage.
- Motion Sensor (Conceptual/Enhancement for "Motion"): While not explicitly listed in components (HX711 and DHT11 are), the "Overview" mentions "motion." For true motion detection (e.g., drops, excessive shocks, or unauthorized opening based on package orientation), an accelerometer (e.g., MPU6050, ADXL345) would be an ideal addition. If included, it would track sudden movements or impacts, further enhancing tamper detection. For the current scope, "motion" can primarily refer to general transit, with active "tampering" primarily inferred from weight changes.
The ESP8266 microcontroller is the ideal choice for this portable monitoring unit due to its small form factor, integrated Wi-Fi, and low power consumption (critical for battery operation during transit). The ESP8266 will:
- Read and interpret data from the HX711 and DHT11 sensors.
- Perform local anomaly detection by comparing real-time sensor values against calibrated baselines and defined environmental thresholds.
- Manage Wi-Fi connectivity and securely transmit data.
Communication with a central server is handled efficiently using the MQTT protocol. MQTT's lightweight, publish-subscribe model is perfectly suited for battery-powered IoT devices, minimizing power consumption while ensuring reliable data transmission. Periodic updates are sent to a central MQTT broker, and critical alerts are triggered immediately when anomalies (e.g., weight drop, temperature spike, high humidity) are detected.
The data is then visualized on a robust dashboard built with Grafana (for powerful analytics and custom dashboards) or Blynk (for quick mobile app integration and simplicity). These dashboards provide stakeholders with:
- Real-time status of each parcel's integrity and environmental conditions.
- Historical data logs for post-transit analysis and route optimization.
- Visual alerts and notifications that can be configured to trigger SMS/email to relevant parties (e.g., logistics managers, security teams, recipients).
This system provides complete transparency over package conditions, drastically reducing losses, improving customer satisfaction, and building trust in the logistics chain.
Step-by-Step Procedure:
- Sensor Integration into Packaging Unit:
- Load Cell Mounting: Carefully embed the load cell (e.g., a small button load cell or beam load cell) into the base of the packaging unit. Ensure it's positioned to accurately measure the total weight of the contents, and that the packaging design allows the load to be directly transferred to the sensor. Use a small platform or stand for the contents to rest on the load cell.
- DHT11 Placement: Securely mount the DHT11 temperature and humidity sensor inside the packaging unit, away from direct contact with contents but in an area that reflects the internal environment.
- ESP8266 & Battery Placement: Integrate the ESP8266 module and a compact, rechargeable battery (e.g., LiPo battery with appropriate charging circuit) within the packaging unit. Ensure easy access for charging if needed.
- Hardware Connection and Calibration:
- HX711 Wiring: Connect the load cell to the HX711 amplifier breakout board (typically E+/E-/A+/A- or similar pins to the load cell's excitation and signal wires).
- HX711 to ESP8266: Connect the HX711's Data (DOUT) and Clock (SCK) pins to appropriate digital GPIO pins on the ESP8266.
- DHT11 to ESP8266: Connect the DHT11's data pin to a digital GPIO pin on the ESP8266.
- Power Supply: Power the ESP8266 and sensors from the integrated battery.
- Initial Calibration:
- Weight Calibration: Program the ESP8266 to read raw values from the HX711. Calibrate the load cell by placing known weights on it and mapping the raw sensor readings to actual grams/kilograms. Record the initial weight of the empty package and the intended full package weight.
- Environmental Thresholds: Define acceptable temperature and humidity ranges for the specific parcel contents (e.g., 2°C-8°C for cold chain, 40%-60% RH for electronics).
- ESP8266 Firmware Development:
- Arduino IDE/PlatformIO Setup: Configure your development environment for ESP8266.
- Libraries: Install necessary libraries for HX711 (e.g.,
HX711.h), DHT11 (e.g.,DHT.h), Wi-Fi, and MQTT (e.g.,PubSubClient.h). - Sensor Reading Logic: Write code to continuously read calibrated weight from the HX711 and temperature/humidity from the DHT11.
- Wi-Fi & MQTT Connectivity: Program the ESP8266 to connect to available Wi-Fi networks (it might need to connect to pre-configured hotspots along the transit route or use a mobile hotspot). Implement MQTT client functionality to connect to a central MQTT broker.
- Anomaly Detection Logic: Embed simple logic to detect anomalies:
- Weight Drop: If the current weight drops below a pre-defined percentage of the initial calibrated weight.
- Environmental Breach: If temperature or humidity goes outside the defined safe thresholds.
- Data Packaging & Publishing: Format sensor readings and anomaly flags into a structured JSON payload (e.g.,
{"parcel_id": "P123", "weight_g": 1500, "temp_c": 25.1, "humidity_perc": 55.3, "anomaly": false, "timestamp": "..."}). Publish this payload periodically (e.g., every 5-10 minutes, or upon significant change) to a specific MQTT topic on the central broker. Trigger an immediate MQTT message to a separate "alert" topic if an anomaly is detected. - Power Optimization: Implement deep sleep modes or power-saving techniques to extend battery life during transit.
- Central Server Setup (MQTT Broker & Data Processing):
- MQTT Broker: Set up a central MQTT broker (e.g., Mosquitto on a cloud VM, AWS IoT Core, Google Cloud IoT Core, or HiveMQ Cloud).
- Data Receiver/Processor: Develop a server-side application (e.g., using Node.js, Python Flask/Django) that subscribes to the MQTT topics where the ESP8266 publishes data (
parcel/statusandparcel/alerts). - Database Integration: Store the incoming parcel data in a time-series database (e.g., InfluxDB, PostgreSQL with TimescaleDB, or a NoSQL database like MongoDB for flexibility) for historical analysis.
- Alert Triggering: Implement server-side logic to process incoming anomaly alerts. This logic can trigger external notifications.
- Alerting & Dashboard Visualization:
- SMS/Email/Push Notifications: Configure the central server application to send alerts via:
- SMS: Using Twilio or similar SMS gateway services.
- Email: Using SMTP services (e.g., SendGrid, Mailgun).
- Push Notifications: Via a mobile app's push notification service (e.g., Firebase Cloud Messaging).
- Alerts should include parcel ID, anomaly type, and time.
- Grafana/Blynk Dashboard Development:
- Grafana: Connect Grafana to your time-series database. Create detailed dashboards displaying:
- Real-time weight, temperature, and humidity for each parcel.
- Historical graphs showing trends over time.
- Anomaly indicators and alert logs.
- (If GPS is added) A map showing the parcel's route and anomaly locations.
- Blynk: If using Blynk as the central platform, set up widgets (gauges, graphs, notification widgets) to visualize data and receive push alerts directly on the mobile app. Configure automations within Blynk for SMS/email alerts.
- Grafana: Connect Grafana to your time-series database. Create detailed dashboards displaying:
- SMS/Email/Push Notifications: Configure the central server application to send alerts via:
- System Testing, Validation, and Refinement:
- Lab Testing: Simulate various scenarios:
- Weight Tampering: Remove items from the package to trigger weight alerts.
- Environmental Stress: Expose the package to high/low temperatures or humidity levels to test DHT11 and threshold alerts.
- Connectivity: Test Wi-Fi switching and MQTT re-connection behavior.
- Field Testing: Conduct pilot runs with actual parcels on various routes to assess real-world performance, battery life, and connectivity robustness.
- Threshold Optimization: Continuously fine-tune anomaly detection thresholds to minimize false positives and ensure accurate detection of genuine incidents.
- Security Audit: Ensure all data transmission and storage are secure.
- Lab Testing: Simulate various scenarios:
Components & Tech Used:
- Microcontroller: ESP8266 NodeMCU/Wemos D1 Mini (for Wi-Fi connectivity and processing).
- Sensors:
- HX711 Load Cell Amplifier (for precision weight measurement).
- Mini Load Cell (appropriate weight capacity for parcels).
- DHT11 Temperature and Humidity Sensor (for environmental monitoring).
- (Optional but Recommended for "Motion"): MPU6050 or ADXL345 Accelerometer (for impact/shock detection).
- Connectivity: Wi-Fi, MQTT (Message Queuing Telemetry Transport).
- Cloud/Server Infrastructure:
- MQTT Broker (e.g., Mosquitto, AWS IoT Core, HiveMQ Cloud).
- Database (e.g., InfluxDB, PostgreSQL, MongoDB).
- Server-side application (Node.js, Python Flask/Django).
- Dashboard & Visualization: Grafana (for powerful dashboards) or Blynk (for rapid mobile app integration).
- Alerting Services: Twilio (for SMS), SendGrid/Mailgun (for Email), Firebase Cloud Messaging (for Push Notifications).
- Programming Languages/Tools: Arduino IDE (for ESP8266 firmware), Python/Node.js (for server-side logic).
Benefits:
- Package Tamper Detection: Immediate alerts for unauthorized opening or removal of contents based on weight changes, significantly enhancing supply chain security.
- Environmental Compliance: Ensures sensitive goods remain within required temperature and humidity ranges, preventing spoilage, damage, and ensuring regulatory compliance (e.g., cold chain monitoring).
- Transit Condition Monitoring: Provides granular data on how packages are handled, identifying instances of mishandling, excessive shocks, or deviations from optimal transit conditions.
- Reduced Losses & Damages: Proactive identification of issues minimizes financial losses due to theft, spoilage, or damaged goods.
- Enhanced Accountability: Creates a clear audit trail of conditions and events during transit, assigning accountability within the logistics chain.
- Improved Customer Satisfaction: Ensures goods arrive in expected condition, building trust and improving client relationships.
- Optimized Logistics: Data insights can inform better packaging design, route optimization, and carrier selection.
Project 7: Industrial Package Integrity Detection Codes:
🔗 View Project Code on GitHub📊 Dashboard Visualization:
You can now use Grafana or Blynk to:
· Monitor real-time humidity, temperature, and weight
· Visualize trends over time
· Set alert triggers for:
o Weight drop (possible tampering)
o High humidity (damaged packaging/environment)
Boom 💥 Let's level this up and make it industry-grade.
Here’s your complete setup for the Industrial Package Integrity Detection System with:
🧠 What You're Getting:
· Full Grafana Dashboard JSON
· MQTT Broker Setup Guide
· Optional Firebase Integration
· Alert Setup using Grafana + InfluxDB OR Twilio
8. 🌀 Air Quality and Ventilation Monitoring in Plants

8. 🌬️ IoT Smart Air Quality Monitoring & Ventilation Control
Overview: Maintaining optimal indoor air quality (IAQ) in industrial environments is paramount for worker health, safety compliance, and even equipment longevity. Poor air quality, stemming from pollutants, fumes, or inadequate ventilation, can lead to serious health issues and regulatory non-compliance. This project introduces a comprehensive IoT Smart Air Quality Monitoring & Ventilation Control System designed for factories and industrial facilities. By deploying a network of specialized gas sensors (MQ-135, MQ-2) and environmental sensors (DHT22), the system continuously tracks various air pollutants and environmental factors. An ESP32 microcontroller intelligently processes this raw data, calculating a real-time Air Quality Index (AQI) using sensor fusion techniques. Crucially, the system automates ventilation fans via smart relays when AQI levels exceed predefined safe limits, ensuring a healthier and safer workspace. All data is logged to a cloud platform like ThingSpeak for historical tracking and accessible via a mobile app for plant managers, enabling proactive management and adherence to workplace safety norms.
About the Project: This project provides an automated, data-driven solution to a critical industrial challenge: ensuring healthy and compliant indoor air quality. It integrates multiple sensors and a robust control mechanism with cloud connectivity for comprehensive environmental management.
The system relies on a suite of sensors to provide a holistic view of the factory's air quality:
- MQ-135 Gas Sensor: This is a versatile air quality sensor capable of detecting a broad range of harmful gases, including ammonia, sulfur compounds, benzene vapor, carbon dioxide (CO2), and smoke. It serves as a general indicator of overall air contamination.
- MQ-2 Gas Sensor: Primarily focused on detecting combustible gases and smoke, such as LPG, propane, methane, hydrogen, alcohol, and carbon monoxide. This is crucial for early detection of potential fire hazards or dangerous gas leaks.
- DHT22 Temperature and Humidity Sensor: Environmental factors like temperature and humidity can influence the performance of gas sensors and also impact worker comfort and health. The DHT22 provides accurate readings for these parameters, which can also be factored into the overall AQI calculation.
The ESP32 microcontroller acts as the intelligent edge device. It is responsible for:
- Sensor Data Acquisition: Continuously reading analog and digital outputs from the MQ-135, MQ-2, and DHT22 sensors.
- Sensor Fusion & AQI Calculation: This is a key analytical component. Raw sensor readings are often noisy and interdependent. The ESP32 implements logic (or a simple algorithm) to combine the inputs from all sensors to calculate a more robust real-time Air Quality Index (AQI). This might involve weighting different gas concentrations, normalizing values, and potentially applying a simple machine learning model (e.g., linear regression) to derive a single AQI score.
- Automation Logic: Based on the calculated AQI, the ESP32 controls ventilation fans via a relay module. If the AQI exceeds a predefined safe limit, the fans are automatically activated to purge contaminated air. If the AQI drops back to acceptable levels, the fans can be turned off, optimizing energy consumption.
For cloud connectivity and data storage, the system utilizes ThingSpeak. ThingSpeak is an IoT analytics platform that allows for real-time data collection, analysis, and visualization. The ESP32 securely pushes periodic sensor data (individual gas concentrations, temperature, humidity, and calculated AQI) to specific channels on ThingSpeak. This provides:
- Historical Tracking: A long-term record of air quality trends, crucial for compliance reporting and identifying persistent issues.
- Basic Visualization: ThingSpeak's built-in charts can display real-time and historical data.
For plant managers and administrators, a mobile application (which can be a custom app or via Blynk/ThingSpeak's mobile interface if they offer sufficient features) allows for remote monitoring of real-time AQI levels, manual override of ventilation controls (if desired), and reception of critical alerts. This comprehensive approach ensures a safer, healthier, and more energy-efficient industrial environment by automating a vital safety function.
Step-by-Step Procedure:
- Sensor Connection & Physical Setup:
- Sensor Placement: Strategically mount the MQ-135, MQ-2, and DHT22 sensors in various factory zones where air quality monitoring is critical (e.g., near machinery, chemical processes, welding stations, or common work areas). Ensure proper airflow around sensors.
- Connect to ESP32:
- Connect the analog output of MQ-135 and MQ-2 (often via a voltage divider if needed, or directly to an analog input pin - ADC - on the ESP32).
- Connect the data pin of the DHT22 to a digital GPIO pin on the ESP32.
- Connect the relay module to a digital output pin on the ESP32. This relay will switch the power to the ventilation fan(s). Ensure the relay is rated for the fan's voltage and current.
- Provide a stable 3.3V or 5V power supply to the ESP32 and all sensors.
- ESP32 Programming & Sensor Fusion for AQI:
- Arduino IDE/PlatformIO Setup: Configure your development environment for ESP32.
- Libraries: Install necessary libraries for MQ sensors (often custom code, or specific libraries like
MQUnifiedsensorfor more advanced ones), DHT22 (DHT.h), Wi-Fi, and ThingSpeak (ThingSpeak.h). - Sensor Data Reading: Write firmware to continuously read data from all sensors.
- For MQ sensors, read analog voltage and convert to approximate ppm values (requires calibration curves).
- For DHT22, read temperature and humidity.
- AQI Calculation (Sensor Fusion): Implement the logic for calculating a combined AQI. This often involves:
- Normalizing individual sensor readings (e.g., mapping ppm values to a 0-100 scale or defining thresholds).
- Potentially weighting different gases based on their toxicity or relevance to the environment.
- Adjusting readings based on temperature/humidity if sensor datasheets recommend it.
- A simple formula could be a weighted average or a rule-based system.
- Wi-Fi & ThingSpeak Connectivity: Program the ESP32 to connect to the factory's Wi-Fi network. Configure the ThingSpeak API key and channel ID in the code.
- Threshold Definition: Define safe AQI thresholds (e.g., "Good," "Moderate," "Unhealthy for Sensitive Groups," "Unhealthy") that will trigger fan automation.
- Automation Logic & ThingSpeak Data Push:
- Fan Control Logic: Implement a loop in the ESP32 firmware that:
- Reads current AQI.
- If AQI >
Unhealthy_Threshold, turn ON the relay (activating the ventilation fan). - If AQI <
Good_Threshold(or a slightly lower threshold to prevent rapid cycling), turn OFF the relay. - Add a small delay or hysteresis to prevent rapid on/off switching.
- ThingSpeak Data Push: Periodically (e.g., every 30 seconds to 1 minute) publish the individual sensor readings (gas ppm, temp, humidity) and the calculated AQI to your ThingSpeak channel fields using
ThingSpeak.writeFields().
- Fan Control Logic: Implement a loop in the ESP32 firmware that:
- Visualization on Mobile App for Plant Managers:
- ThingSpeak Charts: ThingSpeak automatically generates real-time and historical charts for each field you push. These charts can be embedded or viewed directly from the ThingSpeak website.
- Custom Mobile App (Optional): For a more tailored experience, develop a simple mobile application (using platforms like Blynk, MIT App Inventor, or a custom web app with a framework like React Native if more advanced) that fetches data from the ThingSpeak API.
- Key Displays: The mobile app should display:
- Current AQI value (prominently).
- Status of the ventilation fan (ON/OFF).
- Individual sensor readings.
- Simple historical trends.
- (Optional) Manual override for fan control.
- System Testing, Calibration, and Refinement:
- Sensor Calibration: Calibrate the MQ sensors by exposing them to known concentrations of gases (if possible) or by running them in a known "clean" air environment to establish a baseline. Fine-tune the conversion formulas from analog readings to ppm.
- Automation Testing: Simulate high AQI conditions (e.g., using smoke, exhaled breath for CO2) to test if the fans turn ON and OFF correctly at defined thresholds.
- Connectivity Test: Verify stable Wi-Fi connection and data push to ThingSpeak. Check for data integrity on the ThingSpeak dashboard.
- Threshold Optimization: Continuously monitor the system's performance in the factory environment. Adjust AQI thresholds based on real-world conditions, expert feedback, and regulatory requirements to optimize fan operation and air quality.
- Fan Integration Safety: Ensure the relay and fan wiring meet all electrical safety standards and that the fan itself is appropriate for the industrial environment.
Components & Tech Used:
- Microcontroller: ESP32 (highly capable, integrated Wi-Fi).
- Gas Sensors:
- MQ-135 (for general air quality, CO2, smoke, ammonia).
- MQ-2 (for flammable gases, smoke, CO, LPG).
- Environmental Sensor: DHT22 (for temperature and humidity).
- Actuator Control: Relay Module (to switch ventilation fans on/off).
- IoT Platform: ThingSpeak (for data collection, storage, and basic visualization).
- Communication: Wi-Fi.
- Visualization: ThingSpeak's web interface, custom mobile app (optional).
- Programming Language/IDE: Arduino IDE (for ESP32 firmware).
Benefits:
- Maintain Healthy Work Environment: Proactively manages air quality by automating ventilation, reducing worker exposure to harmful pollutants and improving overall well-being.
- Automated Ventilation: Eliminates manual fan control, ensuring timely and efficient air circulation based on real-time data, optimizing energy consumption.
- Compliance with Workplace Safety Norms: Provides continuous monitoring and historical data, helping factories meet regulatory requirements for air quality and occupational safety.
- Early Detection of Hazards: Rapidly identifies gas leaks or smoke, providing early warnings for potential fire risks or hazardous conditions.
- Data-Driven Insights: Historical data helps identify pollution sources, ventilation inefficiencies, and long-term air quality trends.
- Cost Savings: Optimizes energy use by running fans only when necessary, and prevents costly fines or operational shutdowns due to non-compliance.
Project 8: Air Quality and Ventilation Monitoring in Plants Codes:
🔗 View Project Code on GitHub✅ Replace Before Flashing:
· Replace "YOUR_WIFI_SSID" and "YOUR_WIFI_PASSWORD" with your network details.
· Replace "YOUR_THINGSPEAK_API_KEY" with your ThingSpeak Write API key.
🔄 Extensions You Can Add:
· Firebase sync for mobile app control.
· Real AQI algorithms using calibrated sensor data.
· LCD/OLED display for on-device readout.
· Multi-zone dashboard in Grafana via InfluxDB.
here's how we can expand this Industrial Air Quality project further — to make it truly mission-grade, enterprise-level, and future-ready.
🔧 Full IoT Stack Integration Roadmap
🔐 1. Secure Cloud Integration
· MQTT over TLS with AWS IoT Core or HiveMQ.
· ESP32 with embedded certificates (PEM format).
· Ensure OTA firmware updates for security patches.
📈 2. Advanced Dashboarding
· Push sensor data to InfluxDB or Firebase Realtime DB.
· Use Grafana to create an interactive AQI dashboard with:
o Real-time AQI score
o Temperature & Humidity trends
o Historical heatmaps by shift/floor
o Downtime vs AQI correlation
🚨 3. Alert & Automation Logic
· Define alert rules using:
o AWS IoT Rules Engine + Lambda + SNS
o OR Node-RED + Twilio API for SMS/email/Telegram
· Use edge ML for predictive air saturation patterns (TensorFlow Lite on ESP32).
📲 4. Mobile App Integration
· Blynk, Flutter, or Firebase-connected app to:
o Control fans
o View AQI & trends
o Get real-time push alerts
o Override system settings remotely
🔋 Suggested Hardware Upgrades (Optional)
|
Component |
Purpose |
|
MQ-9 |
CO and CO₂ detection |
|
PMS5003 |
Accurate particulate matter data |
|
OLED Display |
On-site readout |
|
RTC Module |
Timestamp accuracy offline |

🚀 Ready to turn your IoT knowledge into a career-ready superpower?
At Huebits, we don’t just teach IoT—we train you to build, deploy, and dominate the industry with hands-on hardware experience, real-world projects, and cloud-integrated systems like AWS IoT, Grafana, and MQTT.
🛠️ Whether you're a student, engineer, or tech enthusiast, our Industry-Ready IoT Program is designed to make you future-proof. Learn edge computing, embedded systems, and AI-integrated automation—all in one power-packed journey.
🎓 Next Cohort starts soon!
🔗 Join Now to reserve your spot and take the first step into India’s ₹1.3 trillion IoT future.
9. 🧊 Cold Chain Logistics Monitoring
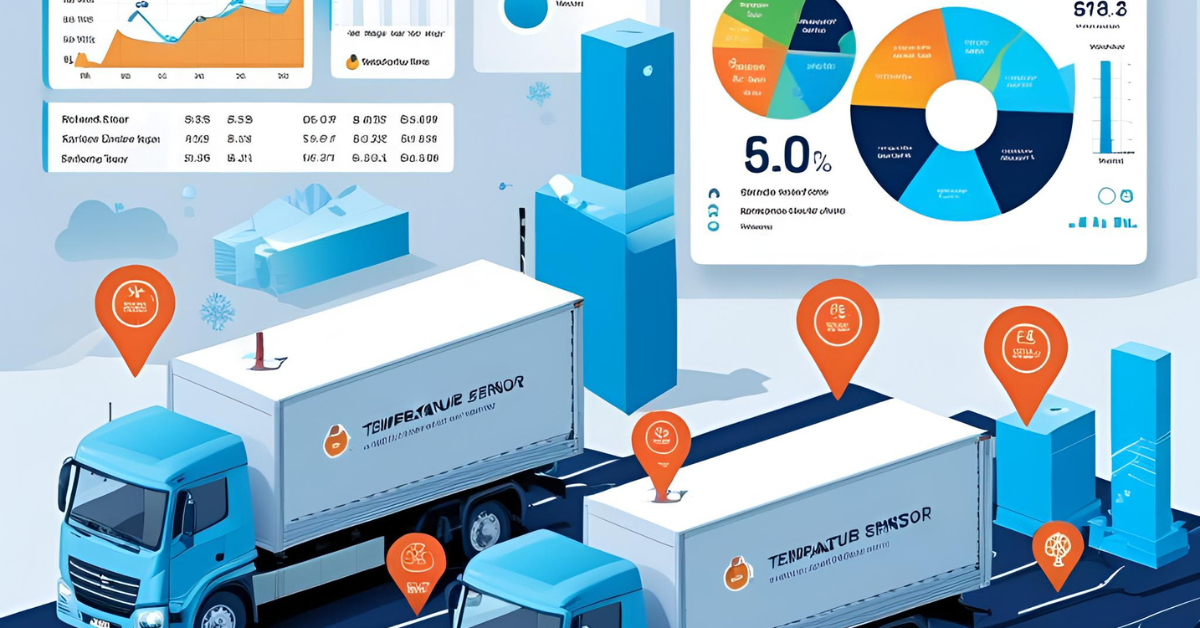
Overview: Maintaining strict temperature control is absolutely critical for the safe transit of temperature-sensitive goods such as pharmaceuticals, vaccines, perishable foods, and biological samples. Breaches in the "cold chain" can lead to product spoilage, loss of efficacy, significant financial losses, and severe regulatory non-compliance. This project introduces a robust Cold Chain Monitoring System designed to provide unparalleled visibility and immediate alerts throughout the logistics journey. By integrating a precise DS18B20 temperature sensor with a GPS module, the system not only tracks the internal temperature of the cargo but also its exact geographical location in real-time. Crucially, it utilizes a GSM module (GSM800) to send instant SMS alerts to relevant stakeholders when temperature conditions breach safe thresholds, even in remote areas without internet connectivity. All data is simultaneously logged to an SD card for comprehensive auditing, ensuring complete traceability and compliance with stringent cold chain regulations.
About the Project: This project delivers an autonomous, self-contained solution for ensuring the integrity and safety of temperature-sensitive cargo from origin to destination. It's designed to be robust, reliable, and effective even in challenging logistical environments.
The core of the system is built around a combination of key hardware modules:
- DS18B20 Temperature Sensor: Chosen for its digital output, excellent accuracy, and ability to be daisy-chained (allowing multiple sensors with a single data pin if monitoring different sections of a cargo), the DS18B20 reliably measures the ambient temperature inside the packaging or cargo container.
- GPS Module: This essential component provides precise geographical coordinates (latitude, longitude) of the package's location. This is crucial not just for tracking the route, but specifically for pinpointing where and when a temperature breach occurred, aiding in root cause analysis and accountability.
- Arduino Uno Microcontroller: This serves as the brain of the system, responsible for:
- Reading data from the DS18B20 and GPS module.
- Processing GPS NMEA sentences to extract latitude and longitude.
- Comparing the measured temperature against predefined safe thresholds.
- Managing data logging to the SD card.
- Interfacing with the GSM module.
- GSM800 Module: This powerful module enables cellular communication. Its primary role is to send SMS alerts instantly when a temperature excursion is detected. This is particularly valuable as it functions independently of Wi-Fi or internet hotspots, making it suitable for long-haul transit through diverse geographical areas. The SMS message can include the nature of the breach, the current temperature, and the exact GPS coordinates.
- SD Card Module: This provides on-device data storage, creating a robust offline audit trail. Even if GSM connectivity is lost or delayed, all temperature, time, and location data are continuously logged to the SD card. This ensures complete traceability for regulatory compliance, post-transit analysis, and dispute resolution.
The data, once logged, can be later retrieved from the SD card and visualized on a mobile-friendly dashboard. This dashboard would combine the temperature readings with the geographical data, allowing logistics managers to graphically see the entire transit route, identify specific points where temperature breaches occurred, and analyze historical temperature profiles. This system provides critical insights, enhances product safety, and minimizes financial losses associated with cold chain failures.
Step-by-Step Procedure:
- Hardware Assembly and Sensor Mounting:
- Connect DS18B20: Wire the DS18B20 digital temperature sensor to the Arduino Uno (typically involves a single data pin, VCC, GND, and a 4.7kΩ pull-up resistor). Mount the sensor securely within the cargo unit or specialized packaging, ensuring it accurately reflects the internal temperature of the goods.
- Connect GPS Module: Connect the GPS module (typically via UART pins, RX/TX) to the Arduino Uno. Ensure the GPS antenna has a clear view of the sky for optimal satellite reception.
- Connect GSM800 Module: Wire the GSM800 module to the Arduino Uno (UART pins, RX/TX). Insert a valid SIM card with SMS capabilities into the GSM module. Connect an external power supply to the GSM module if the Arduino cannot provide sufficient current.
- Connect SD Card Module: Wire the SD card module (typically via SPI pins) to the Arduino Uno. Insert a formatted SD card.
- Power Supply: Provide a stable power supply to the Arduino Uno and ensure the GSM module receives adequate current, especially during transmission.
- Arduino Uno Firmware Development:
- Arduino IDE Setup: Configure your development environment for the Arduino Uno.
- Libraries: Install necessary libraries for DS18B20 (e.g.,
OneWire.h,DallasTemperature.h), GPS (e.g.,TinyGPSPlus.h), and GSM (e.g.,SoftwareSerial.hfor custom serial communication if hardware serial is used for GPS, and specific AT command handling for GSM). - Sensor Reading Logic: Write code to continuously read temperature from the DS18B20 and parse NMEA sentences from the GPS module to extract latitude, longitude, date, and time.
- Threshold Definition: Define the critical temperature range (e.g., 2°C to 8°C for vaccines).
- GSM Initialization: Program the Arduino to initialize the GSM module and check for network registration.
- Alerting via GSM (SMS) & SD Card Logging:
- Temperature Monitoring & SMS Alert Logic: Implement a loop that continuously checks the temperature. If the temperature falls below the lower threshold or exceeds the upper threshold:
- Construct an SMS message including the
parcel_ID,current_temperature,latitude,longitude, andtimestamp. - Use the GSM module to send this SMS to predefined contact numbers (e.g., logistics manager, quality control).
- Implement a cooldown period for alerts to prevent excessive SMS sending for minor fluctuations.
- Construct an SMS message including the
- SD Card Logging Logic: Program the Arduino to:
- Open a new log file on the SD card (e.g., named with a timestamp or parcel ID) at the start of transit.
- Periodically (e.g., every 5-10 minutes, or upon significant temperature change) write a new line to the log file containing
timestamp, latitude, longitude, temperature, status (normal/breach). This ensures data persistence even without network coverage.
- Temperature Monitoring & SMS Alert Logic: Implement a loop that continuously checks the temperature. If the temperature falls below the lower threshold or exceeds the upper threshold:
- Data Visualization (Mobile-Friendly Dashboard):
- Data Retrieval: Upon arrival at the destination or at a checkpoint, the SD card data can be retrieved manually.
- Dashboard Development: Develop a simple mobile-friendly web application or use a data visualization tool (e.g., Google Data Studio, Power BI, custom web app with Leaflet.js for mapping) to:
- Upload the log file from the SD card.
- Display a graph of temperature over time.
- Overlay temperature data points onto a map (using GPS coordinates) to visualize the transit path and highlight exactly where temperature breaches occurred.
- Show summary statistics (e.g., duration of breach, maximum/minimum temperature).
- System Testing, Calibration, and Refinement:
- Sensor Calibration: Calibrate the DS18B20 against a known accurate thermometer.
- GPS Signal Test: Test the GPS module's ability to acquire a fix quickly and accurately in different environments (open sky, indoors near a window).
- GSM Connectivity Test: Verify SMS sending functionality by manually triggering messages and ensuring they are received.
- Temperature Breach Simulation: Place the sensor in a controlled environment (e.g., refrigerator, hot water bath) to simulate temperature breaches and ensure SMS alerts are sent correctly.
- SD Card Logging Test: Verify that data is being correctly written to and retrieved from the SD card.
- Battery Life: Conduct endurance tests to estimate the battery life and optimize power consumption by putting the Arduino/GSM module to sleep when not transmitting.
- Field Testing: Conduct pilot runs with actual parcels on various routes to assess real-world performance, signal reliability, and GPS accuracy.
Components & Tech Used:
- Microcontroller: Arduino Uno (or Arduino Nano for a more compact form factor).
- Temperature Sensor: DS18B20 Digital Temperature Sensor.
- Location Tracking: GPS Module (e.g., NEO-6M).
- Communication: GSM800L Module (or similar GSM/GPRS module for SMS/cellular data).
- Data Storage: SD Card Module (with a micro SD card).
- Power Supply: Battery pack (e.g., LiPo battery with booster module) for portability.
- Programming Language/IDE: Arduino IDE.
- Data Visualization (Post-processing): Web browser (for web dashboard), potentially Python/JavaScript for data parsing and mapping libraries (e.g., Leaflet.js, Google Maps API).
Benefits:
- Compliance in Cold-Chain Logistics: Ensures adherence to stringent regulatory requirements for temperature-sensitive goods, preventing fines and product recalls.
- Instant Breach Alerts: Provides immediate notification via SMS when temperature deviations occur, allowing for rapid intervention to salvage goods or mitigate damage.
- Data Logging for Traceability: The SD card acts as an undeniable audit trail, providing complete historical data on temperature and location for accountability, quality control, and legal purposes.
- Reduced Product Loss: Minimizes spoilage and financial losses caused by temperature excursions.
- Enhanced Customer Trust: Ensures product quality upon delivery, building trust with clients and consumers.
- Optimized Logistics: Data can inform better route planning, carrier selection, and packaging solutions.
- Offline Capability: SMS alerts and SD card logging function even in areas with no internet connectivity, crucial for remote transit.
Project 9:Cold Chain Logistics Monitoring Codes:
🔗 View Project Code on GitHub🔧 Requirements:
· Arduino Uno
· DS18B20 (temperature sensor)
· GSM800 module
· GPS module (e.g., Neo-6M)
· Blynk Legacy App (or Blynk IoT platform)
· Blynk Auth Token
· Virtual Pins:
o V0: Temperature
o V1: Latitude
o V2: Longitude
o V3: Alert flag (1 = breach)
✅ Install Libraries (in Arduino IDE)
· OneWire
· DallasTemperature
· SoftwareSerial
· TinyGPS++ (for GPS)
· BlynkSimpleSerial (for Blynk)
📱 Blynk Dashboard Setup (Legacy or Blynk IoT):
· V0 – Gauge for Temperature
· V1, V2 – Map widget for Location
· V3 – LED or Value Display for Breach Alert
10. 📡 Industrial Machine Energy Consumption Tracker
Overview: Efficient energy management is paramount in industrial settings, impacting operational costs, machinery lifespan, and overall plant safety. Unforeseen power fluctuations or sustained overloads in heavy machinery can lead to premature motor burnout, equipment damage, and costly production downtime. This project introduces a sophisticated Smart Industrial Energy Monitoring & Anomaly Detection System that provides real-time insights into the energy consumption patterns of heavy machinery. By utilizing non-invasive Current Transformers (CTs) like the SCT-013, the system safely measures motor current without direct contact with high-voltage lines. An ESP32 microcontroller processes these readings, intelligently detecting abnormal power fluctuations or sustained overload conditions. The data is pushed to a robust InfluxDB time-series database and beautifully visualized on a Grafana dashboard. Crucially, Node-RED facilitates the creation of powerful alerting logic, enabling instant notifications for potential motor burnout risks and, in critical overload scenarios, can even trigger a relay-based emergency cutoff to protect valuable assets.
About the Project: This project delivers a comprehensive solution for proactive energy management and predictive maintenance for heavy industrial machinery. It focuses on non-invasive data acquisition to ensure safety and scalability across an entire plant.
The core of the system revolves around safe and accurate current measurement:
- SCT-013 Current Sensor (Non-Invasive CT): The SCT-013 is a split-core Current Transformer (CT) sensor. It's non-invasive, meaning it can be clipped around the live wire of a machine's power input without breaking the circuit, making it safe and easy to install. It measures alternating current (AC) and outputs a proportional alternating voltage. Multiple SCT-013 sensors can be used to monitor different phases or multiple machines.
- ESP32 Microcontroller: The ESP32 is chosen for its dual-core processing power, integrated Wi-Fi, and sufficient analog-to-digital converter (ADC) resolution required to read the small AC voltage output from the SCT-013 sensors accurately. The ESP32 will:
- Read the AC voltage from the SCT-013 sensors.
- Perform necessary analog-to-digital conversion and calculations to derive RMS current values.
- Implement algorithms to detect significant deviations from baseline current profiles or sustained periods of high current draw.
- Manage Wi-Fi connectivity and data transmission.
The collected energy data is then streamed to InfluxDB, a high-performance time-series database optimized for handling large volumes of time-stamped data. InfluxDB is ideal for storing metrics like current, voltage, power, and energy consumption over time.
For visualization and powerful analytics, Grafana is integrated. Grafana provides highly customizable and interactive dashboards where plant managers and engineers can:
- View real-time current draw, power consumption, and energy usage graphs for individual machines.
- Analyze historical trends to identify energy wastage, operational inefficiencies, or recurring anomalies.
- Create alerts based on specific data patterns directly within Grafana (though Node-RED is used for more complex logic here).
Node-RED plays a pivotal role in implementing sophisticated alerting and control logic:
- Anomaly Detection Logic: Node-RED can subscribe to data streams from the ESP32 (e.g., via MQTT or directly from InfluxDB). It's used to build flow-based logic to detect anomalies beyond simple thresholds, such as:
- Sustained high current draw (overload).
- Sudden, uncharacteristic spikes or drops in current (potential electrical fault or mechanical issue).
- Deviations from a learned "normal" operational current profile.
- Alerting Mechanism: When anomalies are detected by Node-RED, it can trigger various notifications:
- Email/SMS alerts to maintenance teams, notifying them of potential motor burnout risks.
- Dashboard alerts in Grafana.
- Relay-based Cutoff (Safety Feature): In severe overload scenarios or detected critical faults, Node-RED can send a command back to the ESP32 to activate a relay module. This relay then safely disconnects power to the affected machine, preventing catastrophic damage, motor burnout, or even fire hazards. This is a crucial safety and asset protection feature.
This comprehensive system provides deep insights into machine performance, automates critical safety interventions, and empowers data-driven decisions for energy optimization and predictive maintenance across an entire industrial plant.
Step-by-Step Procedure:
- Sensor Installation and Initial Wiring:
- SCT-013 Installation: Carefully clip the SCT-013 Current Sensors around the live wire(s) of the heavy machine's main power input line(s). For a 3-phase motor, you might use three sensors. Ensure the arrow on the sensor points in the direction of current flow.
- Burden Resistor & Voltage Bias: The SCT-013 outputs an AC voltage that needs to be scaled and biased (shifted to positive values) so that the ESP32's ADC can read it accurately. Connect a burden resistor across the SCT-013 output, and then use a voltage divider with a capacitor to create a DC bias around VCC/2 for the ESP32's analog input.
- Connect to ESP32: Connect the biased AC voltage output from the current sensor setup to an analog input pin (ADC) on the ESP32.
- Connect Relay: Connect a relay module (for controlling the machine's main power contactor or a smaller auxiliary circuit) to a digital output pin on the ESP32. Ensure the relay is rated for the voltage and current of the control circuit.
- Power Supply: Provide a stable power supply to the ESP32.
- ESP32 Firmware Development & Current Calculation:
- Arduino IDE/PlatformIO Setup: Configure your development environment for ESP32.
- Libraries: Install necessary libraries for Wi-Fi and (optionally) MQTT client.
- Current Reading & Calculation: Write firmware for the ESP32 to:
- Continuously sample the analog input from the current sensor's output at a high rate (e.g., thousands of samples per second) to capture the AC waveform.
- Calculate the Root Mean Square (RMS) current from these samples. This requires advanced ADC reading and mathematical processing on the ESP32.
- Implement calibration factors (derived from testing with a known load and multimeter) to convert raw ADC values to actual Amperes.
- Wi-Fi Connectivity: Program the ESP32 to connect to the factory's Wi-Fi network.
- Data Packaging: Format the RMS current readings (and potentially other calculated values like power, if voltage is known) into a JSON payload.
- InfluxDB Setup & Data Ingestion:
- Install InfluxDB: Set up an InfluxDB instance (can be on a local server, a dedicated VM, or use InfluxDB Cloud).
- Create Database/Bucket: Create a database or bucket in InfluxDB to store the energy monitoring data.
- Data Push (from ESP32 or Gateway):
- Option A (ESP32 direct): Program the ESP32 to send HTTP POST requests with the JSON data directly to the InfluxDB HTTP API (requires InfluxDB client library for ESP32).
- Option B (MQTT + Node-RED Gateway - Recommended for robustness): Program the ESP32 to publish current data to an MQTT broker. Then, use Node-RED (running on a local gateway like a Raspberry Pi or server) to subscribe to this MQTT topic and push the data into InfluxDB. This decouples the ESP32 from direct database interaction.
- Grafana Dashboard Visualization:
- Install Grafana: Set up a Grafana instance (can be on the same server as InfluxDB or a separate one).
- Connect Data Source: Add InfluxDB as a data source in Grafana.
- Design Dashboards: Create comprehensive dashboards to visualize:
- Real-time Current (Amperes): Gauges and line charts.
- Historical Trends: Graphs showing current over hours, days, weeks.
- Power & Energy (if calculated): Panels displaying kW, kWh.
- Operational States: Potentially integrate indicators for machine ON/OFF or load levels.
- Node-RED for Alerting Logic & Control:
- Install Node-RED: Install Node-RED on a persistent server (e.g., Raspberry Pi, cloud VM).
- Data Ingestion: Configure Node-RED to either subscribe to the MQTT topic from the ESP32 or pull data from InfluxDB.
- Anomaly Detection Logic: Build Node-RED flows to implement sophisticated alerting rules:
- Threshold Breaches: If current exceeds a set
overload_thresholdfor more thanXseconds. - Pattern Deviation: Compare current patterns to historical "normal" profiles (might require more advanced ML integration within Node-RED or by calling an external ML service).
- Rate of Change: Detect sudden, rapid increases in current.
- Threshold Breaches: If current exceeds a set
- Alerting Configuration:
- Email/SMS: Use Node-RED nodes to send detailed email or SMS alerts to maintenance managers when anomalies are detected.
- Grafana Alerts: Node-RED can also push custom metrics to Grafana for a combined alerting approach.
- Relay Control Logic: When a critical overload or fault is detected, Node-RED sends an MQTT message or an HTTP command back to the ESP32 to toggle the relay connected to the machine's power cutoff circuit. Implement fail-safes (e.g., manual override, watchdog timer).
- System Testing, Calibration, and Refinement:
- Sensor Calibration: Calibrate the current sensors meticulously using a known current source and a multimeter to ensure accurate readings.
- Load Testing: Run the heavy machine under various load conditions (idle, partial load, full load, simulated overload) to:
- Verify current readings.
- Test automation logic (fan control, relay cutoff).
- Evaluate alerting accuracy and response times.
- Network Robustness: Test the system's behavior during Wi-Fi interruptions and power cycling.
- Threshold Optimization: Continuously fine-tune overload thresholds and anomaly detection parameters based on real-world machine behavior and expert feedback.
- Safety Protocols: Ensure that the relay-based cutoff is implemented with appropriate safety interlocks and adheres to industrial electrical safety standards.
Components & Tech Used:
- Microcontroller: ESP32 (for data acquisition and local control).
- Current Sensors: SCT-013 Current Transformer (non-invasive).
- Database: InfluxDB (time-series database).
- Dashboard & Visualization: Grafana.
- Automation & Alerting Engine: Node-RED.
- Actuator: Relay Module (to control machine power contactor).
- Communication: Wi-Fi, MQTT (recommended for robustness with Node-RED).
- Programming Languages/Tools: Arduino IDE (for ESP32), JavaScript/Node.js (for Node-RED flows).
Benefits:
- Overload Protection: Automates emergency power cutoff in critical overload scenarios, preventing motor burnout, equipment damage, and electrical hazards.
- Machine Performance Insights: Provides deep, real-time understanding of energy consumption patterns, allowing for optimization of operational processes and identification of inefficient machines.
- Scalable to Entire Plant: The non-invasive nature of CTs and the distributed architecture (ESP32 + MQTT + InfluxDB/Grafana) makes it easily scalable to monitor numerous machines across an entire factory.
- Predictive Maintenance: Early detection of subtle power fluctuations or deviations helps predict potential mechanical faults before they lead to costly breakdowns.
- Energy Cost Reduction: Identifies opportunities for energy saving by optimizing machine usage and detecting abnormal consumption.
- Enhanced Safety: Proactive alerts and automated cutoffs mitigate electrical risks and potential equipment failures that could endanger personnel.
- Compliance & Reporting: Provides detailed energy consumption data for environmental reporting and internal audits.
Project 10: Industrial Machine Energy Consumption Tracker Codes:
🔗 View Project Code on GitHubRequired libraries:
· PubSubClient (MQTT client for ESP32)
· WiFi
Key points:
· SCT-013 is an AC current clamp sensor; usually outputs analog voltage proportional to current.
· We'll do RMS calculation for current.
· ESP32 sends current readings to MQTT topic.
· Node-RED will consume MQTT and push to InfluxDB.
· Node-RED will also do overload logic and trigger relay via MQTT command.
2. Node-RED Flow (Conceptual)
· MQTT Input node: Listen to plant/machine1/current
· Function node: Check if current exceeds threshold (e.g., 15A)
· Switch node:
o If overload detected → send MQTT ON to plant/machine1/relay to cut power
o Else send OFF
· InfluxDB Out node: Store current data for Grafana
· Grafana: Visualize current usage & alert logs
3. Grafana Dashboard JSON
You’ll want to create a dashboard with:
· Time series graph of current over time
· Threshold line (overload limit)
· Alert panel showing overload events
I can generate a sample JSON Grafana dashboard if you want — just let me know!
Bottom Line:
This solution taps into real-time power monitoring, predictive fault alerts, and remote cutoffs — crucial for heavy industrial reliability. The modular architecture makes it scalable and future-proof.
here’s a clean-cut, pro-level Grafana dashboard JSON tailored for your Industrial Machine Energy Consumption Tracker. This JSON config includes:
· Time series panel tracking Current (Amps) over time
· A static threshold line at 15A (your overload limit)
· Alert rule setup for when current crosses threshold
· Basic layout with panel titles and labels ready to plug into your Grafana
How to use this:
1. In your Grafana instance, go to Dashboards → Manage → Import
2. Paste this JSON and hit import
3. Replace "datasource": "InfluxDB" with your actual InfluxDB datasource name
4. Adjust bucket/query based on your InfluxDB schema — the example assumes measurement named "current" in bucket "machine_energy"
5. The alert triggers when average current > 15A for 1 minute
Next steps:
· Configure alert notifications (email, Slack, SMS) in Grafana
· Link this alert to your Node-RED or AWS SNS for relay actuation or operator alerting
· Set up dashboards for power factor, voltage, or energy consumption
. Here’s a Node-RED flow snippet to handle:
· Subscribe to your ESP32 MQTT topic (e.g., factory/machine/current)
· Check if current > 15A (your overload threshold)
· Trigger a relay control via MQTT (factory/machine/relay) to cut power
· Send alert notification (you can hook this to email/SMS)
How to set it up:
1. Replace "mqtt_broker" with your actual MQTT broker node in Node-RED
2. ESP32 should publish machine current (amps) as plain numbers to factory/machine/current
3. Relay listens to factory/machine/relay topic and acts on "cut_off" or "normal" commands
4. You can extend the function node to also push alerts via email/SMS (using email or twilio nodes)
What this flow does:
· Real-time monitoring from MQTT feed
· Automated relay control to prevent damage
· Ready for scaling and more complex logic (e.g., delays, hysteresis)
Conclusion: Industrial IoT is the Edge Where Legacy Meets Innovation
The landscape of industrial operations is undergoing a profound transformation. The era of reactive factories, where interventions occurred only after breakdowns or incidents, is rapidly becoming a relic of the past. We are now firmly stepping into a new paradigm, powered by the Industrial IoT (IIoT), where operational technology seamlessly merges with information technology at the very edge of the network. This fusion represents a true convergence, allowing legacy industrial infrastructure to gain unprecedented intelligence and connectivity.
The diverse range of IIoT projects we've explored – from AI-driven anomaly detection in critical machinery and environmental systems (like fire/gas detection, conveyor belt diagnostics, and smart energy monitoring) to automated control and transparency solutions (such as intelligent access control and real-time tank level monitoring) – clearly illustrates this shift. These initiatives are not mere upgrades; they are foundational changes enabling industries to move from a state of constant firefighting to one of proactive foresight.
These IIoT projects offer a powerful blend of:
- Automation: Beyond simple task execution, this refers to intelligent, data-driven automation that responds dynamically to changing conditions, optimizing processes, and enhancing safety without constant human intervention.
- Analytics: Real-time data streams from countless sensors are transformed into actionable insights. This allows for immediate anomaly detection, trend identification, and a deep understanding of operational health, moving beyond guesswork to precise, data-informed decision-making.
- Foresight: The ability to predict potential failures, anticipate maintenance needs, and foresee environmental risks. This predictive capability prevents costly downtime, ensures regulatory compliance, and extends the lifespan of valuable assets, ultimately leading to significant cost savings and improved safety records.
Embracing these IIoT systems is not just about incremental improvements; it's about future-proofing industries. It builds resilience against unforeseen challenges, enhances competitiveness through optimized resource utilization, and fosters innovation by leveraging the untapped potential of operational data. These technologies empower organizations to create more agile, efficient, and secure environments that can adapt to the demands of a rapidly evolving global market.
Therefore, the call to action is clear and urgent: Dive into these systems, build prototypes, and industrialize your ambition. Start small, experiment with the readily available components and platforms, gather data, and prove the tangible value. The journey from concept to full industrial deployment might seem vast, but the tools and knowledge are increasingly accessible at the edge.
The machines are speaking—through their vibrations, their temperatures, their energy consumption, and their environmental footprint. They are relaying critical information about their health, their environment, and the security of operations. Are you listening? The future of industrial productivity, safety, and sustainability depends on our ability to not just hear, but to understand and act on their silent, yet profound, insights.
💡 About Huebits Industry-Ready IoT Program

🚀 About This Program?
By 2030, IoT is expected to skyrocket into a ₹1.3 trillion market in India alone. But here’s the truth: companies are gasping for talent that can build real, scalable IoT systems — not just wire an LED and call it innovation.
That’s where Huebits steps in.
We bridge the industry-academia gap with a hands-on, hardware-integrated, and cloud-connected IoT program that gives learners the confidence to build, deploy, and scale IoT solutions from Day 1.
🎖️ Certification:
Get certified by Huebits — backed by industry experts and startups — recognized by hiring partners looking for IoT-ready talent.
🚀 Ready to build the future, not just study it?
🎯 Enroll now in Huebits’ Industry-Ready IoT Program and turn your ideas into IoT-powered reality.

🔥 "Take Your First Step into the IoT Revolution!"
Ready to build real-world IoT projects that actually matter?
Join the Huebits Industry-Ready IoT Program and gain hands-on skills with Raspberry Pi, cloud platforms, and embedded systems — the exact tools used in the industry.
✅ Live mentorship | 🧠 Project-based learning | Hardware kits