🚀 Top 10 Best Internet of Things (IoT) Analytics Projects for 2025 [Real-Time & Predictive Use Cases]
![🚀 Top 10 Best Internet of Things (IoT) Analytics Projects for 2025 [Real-Time & Predictive Use Cases]](/content/images/size/w1200/2025/06/main-page-pic-2.png)
📡 Introduction
In the expansive and ever-evolving IoT universe, the sheer volume of data collected by interconnected devices is staggering. However, merely collecting this data is akin to having an immense library without a cataloging system – its true value remains locked away. This is where analytics commands the stage. The ability to extract actionable insights from this torrent of sensor data is not just a technological capability; it's the fundamental key to unlocking transformative advancements across myriad domains. Imagine the potential: smarter cities that proactively manage traffic and public safety, leaner factories that optimize production and predict machinery failures, healthier individuals empowered by personalized health monitoring, and greener homes that intelligently conserve energy.
The year 2025 isn't about just connecting things anymore – it's profoundly about understanding them. It's about moving beyond basic connectivity to intelligent interpretation. This paradigm shift demands sophisticated tools and techniques that can distill raw, often noisy, sensor signals into clear, concise, and actionable strategies. Whether it's predicting maintenance needs in industrial equipment, identifying anomalies in environmental data, optimizing energy consumption in smart buildings, or personalizing healthcare interventions, advanced analytics is the bridge between raw data and tangible value.
Therefore, to illuminate this crucial shift and showcase the cutting edge of IoT innovation, here’s a power-packed list of the Top 10 IoT Analytics Projects. These projects are meticulously designed to blend the transformative power of machine learning, the immediacy of real-time dashboards, and the scalability of robust cloud integration. Their collective aim is to turn every faint "signal" from an IoT device into a clear, decisive "strategy," driving efficiency, safety, and sustainability across industries and daily life.
Table of Content:
- Smart Disaster Early-Warning System
- Intelligent Air Pollution Mapping Network
- AI-Powered Smart Farming Pest Forecasting
- IoT-Driven Hospital Bed Occupancy Analytics
- Urban Noise Pollution Intelligence System
- Smart Parking Utilization & Dynamic Pricing Engine
- Smart Classroom Environment & Productivity Analytics
- Vehicle Health & Driving Behavior Analytics
- Public Toilet Usage & Hygiene Analytics
- Smart Grid Load Forecasting & Outage Prediction
1.Smart Disaster Early-Warning System
Project Overview:
The Smart Disaster Early-Warning System is an innovative solution designed to proactively mitigate the impact of natural disasters by leveraging real-time environmental data and machine learning. This system continuously monitors crucial parameters such as seismic activity, humidity, temperature, and atmospheric pressure. By analyzing this data through a robust cloud-based pipeline, the system can identify patterns indicative of impending natural calamities like floods, landslides, and earthquakes. The core objective is to provide timely and accurate alerts, enabling communities and authorities to implement early evacuation protocols and disaster response measures, thereby minimizing loss of life and property.
Skills Needed:
- Embedded Systems/Hardware: Experience with sensor integration (soil moisture, seismic, temperature, barometric pressure), microcontrollers (e.g., ESP32, Raspberry Pi), and communication protocols (e.g., I2C, SPI).
- Networking & IoT Protocols: Strong understanding of MQTT for device-to-cloud communication.
- Cloud Platforms: Proficiency in AWS services, particularly AWS IoT Core for device management and data ingestion, S3 for data storage, and SageMaker for machine learning model development and deployment.
- Data Engineering: Skills in data collection, cleaning, transformation, and management for large datasets.
- Machine Learning: Expertise in developing and deploying predictive models (e.g., classification, regression, time-series analysis) for risk scoring. Familiarity with Python and ML libraries (e.g., scikit-learn, TensorFlow, PyTorch).
- DevOps & MLOps: Knowledge of continuous integration/continuous deployment (CI/CD) practices for model updates and system maintenance.
- Web Development (Optional, for Dashboard): Front-end frameworks (e.g., React, Angular, Vue.js) for building interactive dashboards.
- Mobile Development (Optional, for SMS/App Integration): Experience with SMS APIs (e.g., Twilio) and potentially mobile app development for enhanced alerts.
- Communication & Collaboration: Ability to work in a team and communicate technical concepts effectively.
Components & Technologies Used:
- Sensors:
- Soil Moisture Sensors: To detect changes in soil water content, crucial for predicting floods and landslides.
- Seismic Sensors (Geophones): To monitor ground vibrations and detect seismic activity for earthquake prediction.
- Temperature Sensors (e.g., DHT11/22, DS18B20): To monitor ambient and ground temperatures, relevant for various disaster types.
- Barometric Pressure Sensors (e.g., BMP280, BME280): To track atmospheric pressure changes, which can indicate weather shifts leading to floods or storms.
- Edge Devices (Microcontrollers/SBCs): (e.g., ESP32, Raspberry Pi) to collect sensor data and transmit it.
- Communication Protocol:
- MQTT: Lightweight messaging protocol for IoT devices, enabling efficient and reliable data transmission from sensors to the cloud.
- Cloud Platform (AWS):
- AWS IoT Core: Manages communication with IoT devices, ingests sensor data securely, and routes it to other AWS services.
- Amazon S3 (Simple Storage Service): Stores raw and processed sensor data, acting as a data lake for analytics.
- Amazon SageMaker: Provides a fully managed service for building, training, and deploying machine learning models.
- AWS Lambda: Serverless compute for real-time data processing, triggering alerts, and interacting with other services.
- Amazon SNS (Simple Notification Service): For sending real-time SMS alerts to registered users and authorities.
- Amazon CloudWatch: For monitoring system performance and logging.
- Amazon QuickSight (Optional): For building interactive dashboards to visualize data and alerts.
- Analytics & Machine Learning:
- Python: Primary language for data analysis and ML model development.
- Scikit-learn, TensorFlow, PyTorch: ML libraries for developing predictive models (e.g., anomaly detection, classification for disaster type, regression for severity).
- Statistical Models: For baseline analysis and simpler predictions.
- Alerting Mechanisms:
- SMS: Real-time alerts sent to designated phone numbers via SMS API (e.g., AWS SNS, Twilio).
- Dashboard: Web-based interface displaying real-time sensor data, risk scores, and alert status.
Use Cases:
- Flood Prediction: Monitoring soil moisture levels, rainfall data (from external sources), and river levels (from external sources or additional sensors) to predict potential flooding in at-risk areas.
- Landslide Warning: Analyzing soil moisture, seismic activity (micro-tremors), and ground deformation (from inclinometers/GPS - potentially future enhancement) to identify conditions conducive to landslides.
- Earthquake Early Warning: Detecting initial seismic waves (P-waves) which travel faster than destructive S-waves, providing precious seconds to minutes for people to take cover or activate automated safety systems.
- Urban Safety: Deploying sensors in urban areas to monitor structural integrity (e.g., bridge vibrations) and provide early warnings for potential collapses due to seismic activity or other factors.
- Industrial Safety: Protecting critical infrastructure and industrial sites from natural disaster impacts by providing timely alerts for evacuation or shutdown procedures.
- Agricultural Monitoring: Helping farmers predict extreme weather events that could damage crops, enabling them to take preventive measures.
Benefits of the Project:
- Reduced Loss of Life: The most significant benefit is saving lives by providing sufficient time for evacuation and taking protective measures.
- Minimized Property Damage: Early warnings allow for securing assets, moving valuables, and activating protective infrastructure.
- Enhanced Disaster Preparedness: Communities and authorities can develop and refine their disaster response plans based on reliable early warning data.
- Improved Resource Allocation: Emergency services can strategically deploy resources to areas most at risk, optimizing response efforts.
- Increased Public Safety Awareness: Regular alerts and a public dashboard can educate citizens about potential risks and empower them to take personal responsibility for their safety.
- Data-Driven Decision Making: The system provides valuable data for long-term urban planning, infrastructure development, and disaster mitigation strategies.
- Cost-Effective Mitigation: Preventing disasters or reducing their impact is significantly more cost-effective than post-disaster recovery efforts.
- Resilience Building: Contributes to building more resilient communities capable of withstanding and recovering from natural hazards.
Project 1: 1.Smart Disaster Early-Warning System Codes:
🔗 View Project Code on GitHubConclusion and Suggestions:
This React application provides a visual simulation of the "Smart Disaster Early-Warning System" dashboard, showcasing how real-time sensor data can be presented and how risk levels and alerts might be displayed.
To evolve this project into a fully functional system, consider the following next steps:
- Integrate with a Backend: Develop the actual backend infrastructure using AWS IoT Core, Lambda, S3, and SageMaker to ingest, process, and analyze real sensor data.
- Implement Real-time Data Streaming: Use WebSockets or other real-time communication protocols to push data from your backend to this React dashboard.
- Develop Sophisticated ML Models: Train machine learning models (e.g., using historical disaster data and environmental parameters) to more accurately predict specific disaster types and their severity.
- Add Alerting Mechanisms: Connect the backend to Amazon SNS or Twilio to send actual SMS alerts based on the predicted risk level.
- Enhance Data Visualization: Incorporate charting libraries (like Recharts) to display historical sensor data, trends, and risk score evolution over time.
- Geographical Mapping: Integrate a mapping library (e.g., Leaflet, Google Maps API) to visualize sensor locations and affected areas on a map.
- User Authentication and Authorization: Implement secure user login and role-based access control for managing alerts and system configurations.
2.Intelligent Air Pollution Mapping Network
Project Overview:
The Intelligent Air Pollution Mapping Network is a cutting-edge initiative aimed at providing granular, real-time insights into urban air quality. This project deploys a dense network of cost-effective, edge-enabled sensors across a city to continuously measure key pollutants such as PM2.5, PM10, CO2, and NOx. By combining localized sensor data with advanced TinyML models running directly on edge devices and robust cloud infrastructure, the system can analyze air quality trends, identify pollution hotspots, and even predict future pollution spikes. The ultimate goal is to empower citizens, urban planners, and environmental agencies with actionable intelligence to make informed decisions regarding public health, urban development, and environmental policy, leading to healthier and more sustainable cities.
Skills Needed:
· Embedded Systems & Edge Computing: Expertise in microcontrollers (e.g., ESP32) and developing efficient code for resource-constrained environments. Understanding of TinyML for deploying machine learning models on edge devices.
· Sensor Integration: Proficiency in interfacing with various air quality sensors (PM2.5, PM10, CO2, NOx) and handling their data outputs.
· Networking & IoT Protocols: Strong grasp of MQTT for secure and efficient data transmission from edge devices to the cloud.
· Cloud Platforms: In-depth knowledge of Google Cloud Platform (GCP) services, specifically Google Cloud IoT Core for device management and data ingestion, and BigQuery for scalable data warehousing and analytics.
· Data Engineering: Skills in real-time data streaming, data processing (e.g., using Cloud Dataflow or Cloud Functions), data cleaning, transformation, and management for large-scale time-series datasets.
· Machine Learning (Edge & Cloud): Experience in training and optimizing compact ML models (for TinyML) for anomaly detection and local prediction, as well as developing more complex predictive models on the cloud (e.g., forecasting pollution levels). Familiarity with TensorFlow Lite, Scikit-learn, etc.
· Data Visualization & Frontend Development: Proficiency in building interactive dashboards and heatmaps. Experience with web technologies (e.g., React, Angular, Vue.js) and charting/mapping libraries (e.g., D3.js, Mapbox GL JS).
· DevOps: Knowledge of CI/CD practices for deploying edge device firmware updates and cloud infrastructure.
· Environmental Science/Air Quality Domain Knowledge (Beneficial): Understanding of air pollutants, their sources, and health impacts can enhance model development and interpretation.
· Communication & Collaboration: Ability to work effectively in a multidisciplinary team.
Components & Technologies Used:
· Sensors:
o PM2.5/PM10 Sensors: (e.g., PMS5003, SDS011) for measuring fine particulate matter, a major health concern.
o CO2 Sensors: (e.g., MH-Z19B, SCD30) for monitoring carbon dioxide levels, an indicator of ventilation and greenhouse gases.
o NOx Sensors: (e.g., various electrochemical sensors) for nitrogen oxides, common pollutants from combustion.
· Edge Compute:
o ESP32 Microcontroller: Low-cost, Wi-Fi/Bluetooth enabled microcontroller suitable for deploying sensors and running TinyML models.
o TinyML Frameworks (e.g., TensorFlow Lite Micro): Enables deployment of optimized machine learning models directly on resource-constrained microcontrollers for on-device inference (e.g., local anomaly detection, filtering).
· Communication Protocol:
o MQTT: Lightweight publish-subscribe protocol for efficient and secure communication between edge devices and Google Cloud IoT Core.
· Cloud Platform (Google Cloud Platform - GCP):
o Google Cloud IoT Core: Manages device connectivity, authentication, and secure data ingestion from a vast number of IoT devices.
o Google Cloud Pub/Sub: Real-time messaging service for ingesting streaming data from IoT Core and distributing it to various GCP services.
o Google BigQuery: Highly scalable, serverless data warehouse for storing and analyzing massive datasets of historical air quality data.
o Google Cloud Functions/Cloud Dataflow: Serverless compute for real-time data processing, transformation, and aggregation before storage in BigQuery.
o Google Cloud AI Platform / Vertex AI: For training and deploying more complex, high-performance machine learning models for broader city-wide pollution forecasting.
o Google Cloud Storage: For storing raw sensor data backups, model artifacts, and other related files.
· Visualization:
o Web Frameworks: (e.g., React, Angular, Vue.js) for building interactive web dashboards.
o Mapping Libraries: (e.g., Mapbox GL JS, Google Maps JavaScript API, Leaflet.js) for creating live pollution heatmaps and displaying sensor locations.
o Charting Libraries: (e.g., D3.js, Chart.js, Plotly.js) for time-series analytics, historical trends, and detailed sensor readings.
Use Cases:
· Real-time Urban Air Quality Monitoring: Providing citizens and authorities with current air quality index (AQI) values across different neighborhoods.
· Pollution Hotspot Identification: Pinpointing areas with persistently high pollutant levels to inform targeted interventions.
· Personalized Exposure Monitoring: Enabling individuals to check air quality along their commute or in their immediate vicinity, allowing for route adjustments or activity planning.
· Forecasting Pollution Spikes: Predicting periods of poor air quality due to weather patterns, traffic congestion, or industrial activity, allowing for pre-emptive public health advisories.
· Public Health Alerts: Triggering automated alerts via SMS, app notifications, or public displays when air quality reaches hazardous levels.
· Policy Making and Urban Planning: Providing data-driven insights to urban planners for designing greener infrastructure, optimizing traffic flow, and regulating emissions.
· Impact Assessment of Interventions: Measuring the effectiveness of new environmental policies or initiatives by monitoring changes in air quality.
· Environmental Research: Generating large datasets for scientific research on atmospheric conditions and pollution dynamics.
Benefits of the Project:
· Improved Public Health: Proactive alerts and informed decisions help reduce exposure to harmful pollutants, leading to better respiratory and overall health outcomes.
· Enhanced Environmental Awareness: Increases public understanding and engagement with air quality issues, fostering collective action.
· Data-Driven Policy Development: Provides robust evidence for local governments to formulate effective environmental policies and regulations.
· Optimized Urban Planning: Supports the creation of healthier, more breathable cities by informing decisions on zoning, green spaces, and transportation.
· Early Warning for Vulnerable Populations: Enables targeted warnings for individuals with respiratory conditions, children, and the elderly during high pollution events.
· Increased Transparency: Offers a transparent view of air quality, building trust between citizens and authorities.
· Resource Efficiency: Guides the strategic deployment of resources for pollution control and mitigation efforts.
· Contribution to Smart City Initiatives: Forms a foundational component of a truly intelligent and sustainable urban environment.
Project 2: Intelligent Air Pollution Mapping Network Codes:
🔗 View Project Code on GitHubConclusion and Suggestions:
This React application simulates the core visualization aspect of an Intelligent Air Pollution Mapping Network, providing a dynamic heatmap of air quality and an overall AQI. It offers a glimpse into how citizens and authorities could monitor pollution levels in real time.
To transform this simulation into a fully functional and robust system, here are some suggestions for next steps:
- Implement Real Edge Devices & Data Pipeline: Develop firmware for ESP32 devices to collect actual sensor data (PM2.5, PM10, CO2, NOx) and transmit it via MQTT to Google Cloud IoT Core.
- Set up Cloud Data Processing: Configure Google Cloud Functions or Cloud Dataflow to ingest streaming data from IoT Core, perform initial cleaning and aggregation, and store it efficiently in BigQuery.
- Develop Advanced Machine Learning Models:
- For TinyML on Edge: Train lightweight models (e.g., using TensorFlow Lite Micro) for local anomaly detection, data filtering, or basic local trend analysis on the ESP32 itself.
- For Cloud Analytics: Utilize Google Cloud AI Platform / Vertex AI to build more sophisticated models for pollution forecasting (e.g., predicting 24-hour AQI trends) based on historical data, weather patterns, and traffic data.
- Integrate Real-time Mapping: Replace the grid simulation with an actual mapping library (like Mapbox GL JS or Google Maps JavaScript API) to overlay pollution data onto a geographic map of the city.
- Enhance Time-Series Analytics: Incorporate charting libraries (e.g., D3.js, Recharts) to display historical pollution trends, daily/weekly averages, and compare data across different sensor nodes.
- Implement Alerting System: Set up Google Cloud Pub/Sub and Cloud Functions to trigger alerts (e.g., SMS, email, mobile app notifications) when pollution levels exceed predefined thresholds.
- Develop User Authentication & Management: For a production system, implement secure user authentication and potentially features for device management or data access control.
3.AI-Powered Smart Farming Pest Forecasting
Project Overview:
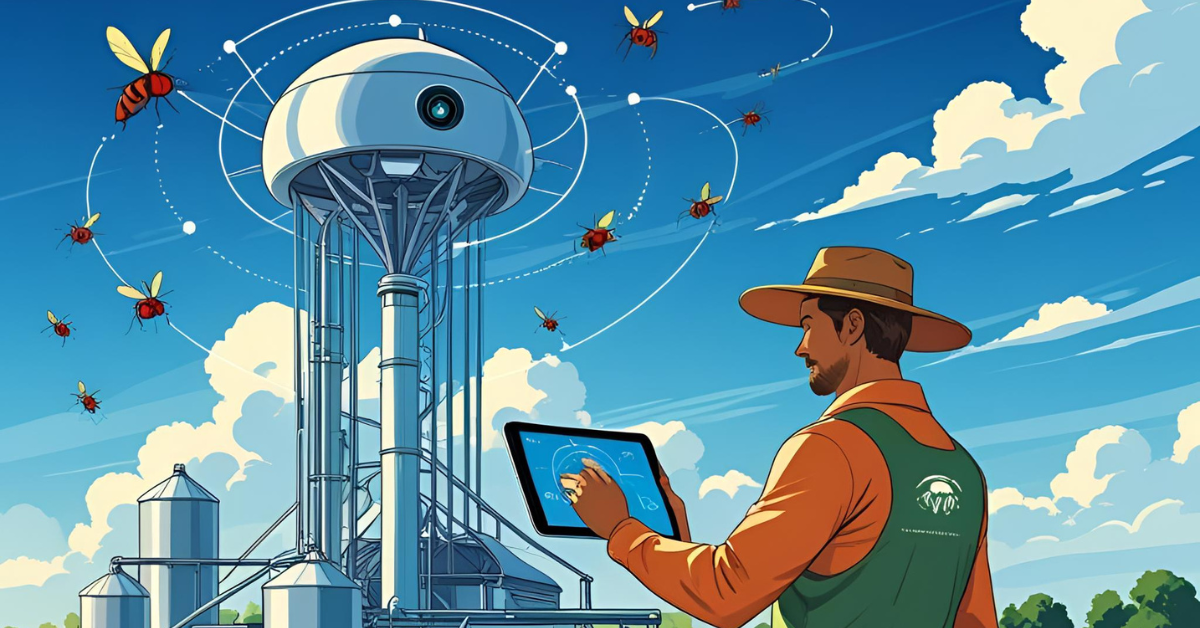
The AI-Powered Smart Farming Pest Forecasting system is an innovative agricultural solution designed to empower farmers with proactive, data-driven insights into potential pest infestations. This system integrates various environmental sensors—measuring temperature, humidity, and soil pH—with advanced visual insect detection capabilities powered by cameras and computer vision. Data collected from the field is processed locally on a Raspberry Pi, which utilizes OpenCV for image analysis to identify and count specific pest types. This granular data, combined with historical pest trends and environmental factors, feeds into a machine learning model (developed with Python and Scikit-learn) to predict the likelihood and severity of future pest outbreaks. The core objective is to alert farmers before infestations become widespread, enabling timely and targeted interventions that significantly reduce reliance on broad-spectrum pesticides, thereby promoting sustainable farming practices, protecting crop yields, and minimizing environmental impact.
Skills Needed:
· Agricultural Domain Knowledge: Understanding of common crop pests, their life cycles, environmental triggers for outbreaks, and typical pest management strategies.
· Embedded Systems & Hardware: Expertise with Raspberry Pi or similar single-board computers, interfacing with various sensors (temperature, humidity, soil pH) and camera modules.
· Computer Vision & Image Processing: Proficiency with OpenCV for image capture, pre-processing, object detection (specifically insect identification), and tracking.
· Machine Learning (ML): Strong background in developing and deploying predictive models, particularly classification and time-series analysis. Experience with Python ML libraries like Scikit-learn, TensorFlow, or PyTorch for training models to forecast pest occurrences.
· Data Engineering: Skills in collecting, cleaning, storing, and managing diverse datasets (sensor readings, image data, historical pest records).
· Python Programming: Essential for data processing, ML model development, and scripting on the Raspberry Pi.
· Networking & IoT Protocols: Basic understanding of local network communication (Wi-Fi) for data transfer from Raspberry Pi to a local server or cloud.
· Cloud Computing (Optional but Recommended): Familiarity with cloud platforms (e.g., AWS, GCP, Azure) for scalable data storage, advanced analytics, and potentially model retraining, if the system is expanded beyond local processing.
· Web/Mobile Development (Optional, for Dashboard/Alerts): Frontend skills (e.g., React, HTML/CSS/JS) for a farm dashboard or mobile app development for alerts.
· DevOps/MLOps (Optional): For managing model updates and system deployment if scaling.
Components & Technologies Used:
· Sensors:
o Temperature Sensors (e.g., DHT11/22, DS18B20): To monitor ambient air temperature, a critical factor influencing insect development and activity.
o Humidity Sensors (e.g., DHT11/22, BME280): To measure relative humidity, which impacts pest reproduction rates and fungal growth.
o Soil pH Sensors: To assess soil acidity/alkalinity, affecting plant health and susceptibility to pests.
o Camera Module (e.g., Raspberry Pi Camera Module): For capturing images of crops and surrounding areas to visually detect insects.
· Edge Compute:
o Raspberry Pi (e.g., Raspberry Pi 4): A versatile single-board computer acting as the central processing unit at the edge. It connects to sensors, captures camera feeds, runs OpenCV for image analysis, and executes the local pest prediction model.
· Image Processing & Computer Vision:
o OpenCV (Open Source Computer Vision Library): Used on the Raspberry Pi for:
§ Image acquisition from the camera.
§ Pre-processing images (e.g., resizing, cropping, enhancing contrast).
§ Implementing object detection algorithms (e.g., Haar cascades, YOLO, SSD Lite for TinyML inference) to identify and count specific insect species.
· Analytics & Machine Learning:
o Python: The primary programming language for data processing, model training, and scripting on the Raspberry Pi.
o Scikit-learn: A powerful Python library for traditional machine learning algorithms (e.g., Logistic Regression, Support Vector Machines, Random Forests) to build the pest prediction model. This model would be trained on historical environmental data and confirmed pest outbreaks.
o Data Storage (Local): Small local database (e.g., SQLite) or flat files on the Raspberry Pi to store recent sensor data and pest counts before aggregation or transfer.
· Data Transfer (Optional Cloud Integration):
o MQTT / HTTP: For transferring aggregated data from the Raspberry Pi to a central cloud platform for long-term storage and advanced analysis (e.g., for retraining models).
o Cloud Platform (e.g., AWS S3, Google Cloud Storage, Azure Blob Storage): For scalable storage of historical sensor data and images.
o Cloud Compute (e.g., AWS Lambda, GCP Cloud Functions, Azure Functions): For serverless processing of data uploaded from edge devices.
o Cloud ML Services (e.g., AWS SageMaker, GCP Vertex AI, Azure Machine Learning): For retraining and optimizing the pest prediction models with larger datasets.
· Alerting & Visualization (Optional):
o SMS Gateway (e.g., Twilio API): To send real-time text alerts to farmers.
o Web Dashboard: A simple web interface to display current conditions, predicted risks, and historical trends.
Use Cases:
· Early Pest Detection & Warning: Notifying farmers immediately when conditions favor pest proliferation or when early signs of specific pests are visually detected, allowing for preventive measures.
· Targeted Pesticide Application: Reducing overall pesticide use by enabling farmers to apply treatments only when and where necessary, minimizing chemical runoff and environmental harm.
· Optimized Crop Management: Informing irrigation schedules, fertilization, and planting times based on environmental conditions and their influence on pest cycles.
· Disease Prevention: Some pests are vectors for plant diseases; early detection can help prevent disease spread.
· Resource Management: More efficient use of labor and resources by predicting when and where attention is most needed.
· Historical Trend Analysis: Analyzing long-term data to understand seasonal pest patterns and adapt farming strategies accordingly.
· Crop-Specific Pest Management: Adapting prediction models for different crops and their unique pest challenges.
Benefits of the Project:
· Significant Reduction in Crop Loss: Proactive measures prevent widespread infestations, protecting valuable harvests.
· Minimized Pesticide Usage: Leads to healthier produce, reduced chemical exposure for farmworkers and consumers, and decreased environmental pollution.
· Increased Farming Sustainability: Promotes eco-friendly agricultural practices, soil health, and biodiversity.
· Cost Savings for Farmers: Reduces expenses on pesticides, labor for extensive monitoring, and losses from damaged crops.
· Improved Food Quality & Safety: Less chemical residue on produce contributes to safer food for consumers.
· Data-Driven Decision Making: Empowers farmers with actionable intelligence instead of relying solely on traditional methods or reactive responses.
· Enhanced Farm Productivity: Optimizes agricultural processes by intervening at the right time and with the right method.
· Contribution to Environmental Protection: Less chemical use benefits local ecosystems, water bodies, and beneficial insects.
Project 3: AI-Powered Smart Farming Pest Forecasting Codes:
🔗 View Project Code on GitHubConclusion and Suggestions:
This React application provides a simulated front-end dashboard for the "AI-Powered Smart Farming Pest Forecasting" system. It showcases how environmental data and simulated pest detections can be presented to a farmer, along with a calculated risk level for pest outbreaks.
To transform this simulation into a real-world, functional system, consider these next steps:
- Hardware Integration: Physically connect temperature, humidity, and soil pH sensors to a Raspberry Pi. Integrate a camera module for actual image capture.
- Edge Processing with OpenCV: Develop Python scripts on the Raspberry Pi to:
- Read sensor data.
- Capture images periodically.
- Use OpenCV to pre-process images and run a lightweight object detection model (e.g., a pre-trained TinyML model for specific pests) to identify and count insects.
- Machine Learning Model Development:
- Data Collection: Gather a comprehensive dataset of environmental conditions, historical pest counts, and confirmed pest outbreaks.
- Model Training: Train a robust classification or regression model (using Scikit-learn, TensorFlow, or PyTorch) on this data to predict pest likelihood and severity.
- Deployment: Deploy the trained model to the Raspberry Pi for on-device inference, or send processed data to a cloud ML service for more complex predictions.
- Data Pipeline & Cloud Integration: Implement a data transfer mechanism (e.g., MQTT or HTTP) to send processed sensor data and pest counts from the Raspberry Pi to a cloud platform (e.g., Google Cloud, AWS, Azure) for long-term storage, advanced analytics, and model retraining.
- Real-time Alerts: Set up SMS gateways (like Twilio) or mobile app notifications to send automated alerts to farmers when the system predicts a high pest risk.
- Comprehensive Dashboard Features: Enhance the dashboard with historical trends, detailed analytics for specific pests, yield forecasts, and perhaps even recommendations for specific interventions based on the pest and its severity.

🚀 Ready to turn your passion for connected tech into real-world impact?
At Huebits, we don’t just teach IoT — we train you to build smart, scalable, and data-driven systems using the tech stacks powering today’s most innovative industries.
From edge devices to cloud platforms, you’ll gain hands-on experience designing end-to-end IoT architectures that collect, analyze, and respond in real time — built for deployment in cities, farms, factories, and homes.
🧠 Whether you're a student, aspiring IoT engineer, or future smart systems architect, our Industry-Ready IoT Engineering Program is your launchpad.
Master Python, Embedded C, MQTT, REST APIs, ESP32, Raspberry Pi, AWS IoT, Azure IoT Hub, and Grafana — all by building real-world IoT solutions that deliver results, not just data.
🎓 Next Cohort Starts Soon!
🔗 Join now and claim your seat in the IoT revolution powering tomorrow’s ₹1 trillion+ connected economy.
4.IoT-Driven Hospital Bed Occupancy Analytics
Project Overview:
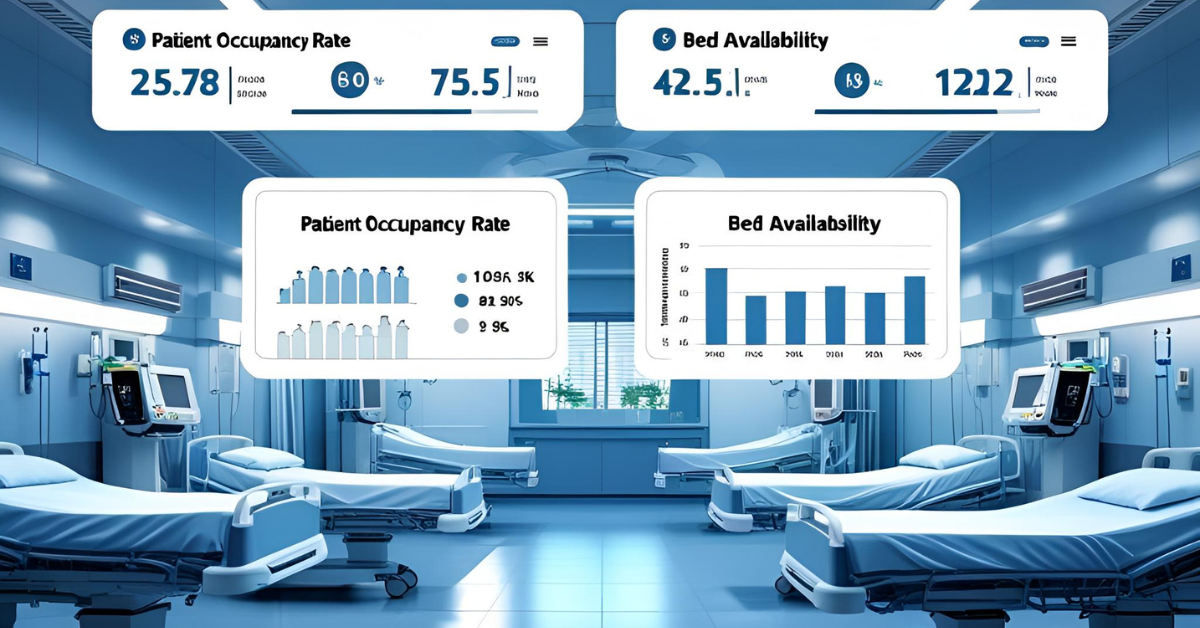
The IoT-Driven Hospital Bed Occupancy Analytics system is a transformative solution designed to optimize hospital operations and enhance patient care through real-time visibility into bed utilization and patient flow. This project leverages unobtrusive sensors (pressure and infrared) integrated directly into hospital beds to collect accurate, real-time occupancy data without impacting patient privacy. This continuous stream of data is then ingested into a robust cloud platform (Azure IoT), processed, and visualized using powerful business intelligence tools (Power BI). At its core, the system employs predictive analytics models to forecast peak patient load times and identify bottlenecks in patient discharge or admission processes. The primary objective is to enable hospital administrators and staff to make data-driven decisions that reduce Emergency Room (ER) overcrowding, optimize resource allocation (staffing, equipment), minimize patient wait times, and ultimately improve the efficiency and quality of healthcare delivery.
Skills Needed:
· Healthcare Domain Knowledge (Beneficial): Understanding of hospital workflows, patient admission/discharge processes, and challenges related to bed management.
· Embedded Systems & Hardware: Experience with integrating pressure and infrared (IR) sensors into beds, and developing firmware for microcontrollers or edge devices (e.g., Raspberry Pi, custom IoT boards) to collect and transmit data.
· Networking & IoT Protocols: Proficiency in MQTT or AMQP for reliable and secure data transfer from devices to the cloud.
· Cloud Platforms: In-depth knowledge of Microsoft Azure services, particularly Azure IoT Hub for device connectivity and management, Azure Stream Analytics for real-time data processing, Azure Data Lake or Cosmos DB for data storage.
· Data Engineering: Skills in real-time data ingestion, processing, transformation, and storage of high-volume streaming data.
· Business Intelligence & Visualization: Expertise in using Power BI (or similar tools like Tableau, Qlik Sense) to create interactive dashboards, reports, and real-time visualizations.
· Machine Learning (ML): Strong background in developing and deploying predictive models (e.g., time-series forecasting, regression) to anticipate patient admissions, discharges, and peak occupancy. Familiarity with Python and ML libraries (Scikit-learn, TensorFlow, PyTorch).
· Data Governance & Security: Understanding of healthcare data regulations (e.g., HIPAA, GDPR) and implementing robust security measures for sensitive patient data.
· DevOps: Knowledge of CI/CD practices for deploying IoT device updates, cloud infrastructure, and analytical models.
· Communication & Collaboration: Ability to work effectively with hospital staff, IT teams, and other stakeholders.
Components & Technologies Used:
· Sensors:
o Pressure Sensors: Integrated into the mattress or bed frame to detect the presence of a patient.
o Infrared (IR) Sensors: Used in conjunction with pressure sensors or as a standalone to detect body heat or presence on the bed, enhancing accuracy and distinguishing from objects.
· Edge Devices:
o Microcontrollers/IoT Gateways: (e.g., ESP32, Raspberry Pi Zero W, custom low-power boards) to collect data from sensors, perform minor edge processing (e.g., aggregation, filtering), and securely transmit data to the cloud.
· Communication Protocol:
o MQTT / AMQP: Lightweight and secure messaging protocols for efficient data transfer from edge devices to Azure IoT Hub.
· Cloud Platform (Microsoft Azure):
o Azure IoT Hub: The central cloud gateway for connecting, monitoring, and managing millions of IoT devices. Securely ingests bed occupancy data.
o Azure Stream Analytics: Real-time stream processing engine to analyze incoming data from IoT Hub, perform aggregations, and identify real-time occupancy changes.
o Azure Functions / Azure Logic Apps: Serverless compute services for triggering alerts, performing data transformations, or integrating with other hospital systems.
o Azure Data Lake Storage / Azure Cosmos DB: Scalable storage solutions for raw and processed historical bed occupancy data. Cosmos DB (NoSQL) is excellent for rapidly changing, high-volume data.
o Azure Machine Learning: For building, training, and deploying predictive models to forecast bed demand and patient flow.
o Azure SQL Database / Azure Synapse Analytics: For structured storage of analyzed data and complex queries for reporting.
· Business Intelligence & Visualization:
o Microsoft Power BI: A powerful and interactive data visualization tool for creating custom dashboards that display:
§ Real-time bed occupancy status (e.g., green for empty, red for occupied).
§ Heatmaps of occupancy across different wards.
§ Historical utilization trends.
§ Predictive forecasts for future bed availability/demand.
§ Patient flow analytics.
· Analytics & Machine Learning:
o Python: Primary language for developing ML models.
o Scikit-learn, TensorFlow, PyTorch: ML libraries for time-series forecasting models (e.g., ARIMA, Prophet, LSTM) to predict patient load, admission rates, and discharge times.
Use Cases:
· Real-time Bed Status Monitoring: Hospital staff can see which beds are occupied, empty, or currently being cleaned across all wards at a glance.
· ER Overcrowding Prevention: Predictive models forecast when ER capacity is likely to be exceeded, allowing for proactive measures like diverting ambulances or preparing additional staff.
· Optimized Patient Placement: Efficiently assign incoming patients to available beds based on their medical needs and ward specialization.
· Streamlined Discharge Planning: Identify beds that are about to become vacant, allowing housekeeping and admission teams to prepare proactively.
· Staffing Optimization: Forecast patient load to adjust nursing and support staff levels, preventing understaffing during peak times and overstaffing during quieter periods.
· Equipment Allocation: Knowing bed occupancy can help in optimizing the distribution of mobile medical equipment (e.g., IV pumps, monitors).
· Resource Utilization Reporting: Generate historical reports on bed turnover rates, average length of stay, and peak utilization periods for strategic planning.
· Facility Expansion Planning: Provide data-driven insights for long-term planning of hospital bed capacity and infrastructure.
Benefits of the Project:
· Reduced ER Wait Times: By optimizing bed allocation and forecasting demand, patients spend less time waiting for a bed.
· Improved Patient Experience: Faster admissions, better resource availability, and reduced stress for patients and their families.
· Enhanced Operational Efficiency: Streamlines hospital workflows, reduces administrative burden, and optimizes staff productivity.
· Cost Savings: More efficient use of existing beds can delay or eliminate the need for costly new construction. Optimizes staffing costs.
· Better Resource Allocation: Ensures that critical resources (beds, staff, equipment) are available when and where they are most needed.
· Data-Driven Decision Making: Empowers hospital management with real-time insights and predictive intelligence to make informed operational and strategic decisions.
· Increased Patient Safety: Reduces the risk associated with overcrowding and improves the speed of care delivery.
· Optimized Revenue Cycle: More efficient patient flow can lead to increased patient throughput and potentially higher revenue.
· Enhanced Hospital Reputation: A reputation for efficient operations and reduced wait times attracts more patients.
Project 4: IoT-Driven Hospital Bed Occupancy Analytics Codes:
🔗 View Project Code on GitHubConclusion and Suggestions:
This React application delivers a simulated dashboard for the "IoT-Driven Hospital Bed Occupancy Analytics" project, demonstrating how real-time bed status, overall occupancy, and a simple forecast can be visualized for hospital staff.
To move this project from a simulation to a fully operational system, here are some key suggestions for next steps:
- Hardware Development & Integration: Design and implement the actual sensor units (pressure and IR) for hospital beds. Develop the firmware for microcontrollers (e.g., ESP32, Raspberry Pi Zero W) to reliably collect this data and securely transmit it.
- Azure IoT Hub Setup: Configure Azure IoT Hub to register and manage these edge devices, ensuring secure and scalable ingestion of bed occupancy data.
- Real-time Data Processing (Azure Stream Analytics): Set up Azure Stream Analytics jobs to process the incoming raw sensor data in real-time. This would involve filtering, aggregating, and transforming the data into meaningful occupancy events (e.g., bed_occupied, bed_empty, bed_cleaning_started).
- Data Storage (Azure Data Lake/Cosmos DB): Establish a scalable data storage solution in Azure (e.g., Data Lake Storage for raw data, Cosmos DB for processed real-time data) to store historical occupancy patterns for analytics and machine learning.
- Predictive Analytics (Azure Machine Learning): Develop and train sophisticated time-series forecasting models using Azure Machine Learning. These models would leverage historical occupancy data, patient admission/discharge patterns, and potentially external factors (e.g., seasonal trends, public health advisories) to predict future bed demand and identify potential bottlenecks.
- Power BI Dashboard Integration: Connect Power BI to the processed data in Azure (e.g., Azure SQL Database or Synapse Analytics) to create dynamic and interactive dashboards that display real-time occupancy, historical trends, and the predictive forecasts from your ML models.
- Alerting & Integration with Hospital Systems: Implement Azure Functions or Logic Apps to trigger alerts (e.g., SMS, email, or integration with hospital EHR/HIS systems) when critical thresholds are met (e.g., ER overcrowding imminent, specific ward reaching full capacity).
- Data Governance & Security (HIPAA/GDPR Compliance): Critically important for healthcare data, ensure all data handling, storage, and access comply with relevant regulations like HIPAA (in the US) or GDPR (in Europe), implementing robust encryption, access controls, and auditing.
5.Urban Noise Pollution Intelligence System

Project Overview:
The Urban Noise Pollution Intelligence System is an innovative solution designed to comprehensively map, monitor, and analyze sound levels across urban environments. This project deploys a distributed network of low-cost, edge-enabled sensing nodes, each equipped with MEMS microphones. These nodes perform real-time Fast Fourier Transform (FFT) analysis on audio data directly at the edge (on ESP32 microcontrollers) to extract crucial acoustic features and calculate decibel levels. The processed noise data is then aggregated and streamed to a central analytics platform, where Python-based tools and Streamlit are used to generate dynamic dashboards and identify distinct sound pollution patterns. The core objective is to provide city planners, environmental agencies, and citizens with actionable insights to detect illegal sound spikes, pinpoint persistent noise sources (e.g., traffic, construction, industrial activity), and inform strategic urban planning efforts aimed at creating quieter, more livable zones within cities.
Skills Needed:
· Acoustics & Sound Engineering (Beneficial): Understanding of sound measurement (dB, dBA), noise types, spectral analysis, and noise pollution standards.
· Embedded Systems & Hardware: Expertise with microcontrollers (e.g., ESP32), digital signal processing (DSP) concepts for audio, and interfacing with MEMS microphones.
· Edge Computing: Ability to develop efficient firmware that performs real-time audio processing (FFT) on resource-constrained devices.
· Python Programming: Essential for data processing, analytics, and building the dashboard.
· Data Analysis & Machine Learning (ML): Skills in analyzing time-series audio data, identifying patterns, and potentially developing ML models for sound event classification (e.g., car horn, construction, human speech vs. ambient noise).
· Data Visualization & Web Development: Proficiency in building interactive web dashboards using frameworks like Streamlit, or other web technologies (HTML, CSS, JavaScript) and charting libraries.
· Networking & IoT Protocols: Basic understanding of Wi-Fi communication for data transfer from edge devices.
· Cloud Computing (Optional): If the system scales, knowledge of cloud platforms (AWS, GCP, Azure) for scalable data storage and advanced analytics services.
· Urban Planning / Environmental Policy (Beneficial): Understanding of urban noise regulations and city development processes.
· DevOps: Knowledge of CI/CD practices for deploying edge device firmware and dashboard updates.
Components & Technologies Used:
· Sensors:
o MEMS Microphones (e.g., ICS-43434, SPH0645LM4H): Low-cost, compact, and low-power digital microphones suitable for continuous audio capture at the edge.
· Edge Compute:
o ESP32 Microcontroller: A powerful and cost-effective Wi-Fi/Bluetooth enabled microcontroller capable of:
§ Capturing raw audio data from MEMS microphones.
§ Performing Fast Fourier Transform (FFT) for frequency analysis to derive sound pressure levels (decibels) and potentially identify dominant frequencies.
§ Executing lightweight logic for anomaly detection or data aggregation before transmission.
· Data Processing & Analytics:
o Python: The primary language for all analytical tasks.
o NumPy / SciPy: Libraries for numerical operations, signal processing, and statistical analysis of noise data.
o Pandas: For data manipulation and time-series management.
· Dashboard & Visualization:
o Streamlit: A powerful open-source Python library that allows quick and easy creation of interactive web applications and dashboards with pure Python. Ideal for rapid prototyping and deployment of data analysis results.
o Plotly / Matplotlib / Seaborn: Python charting libraries used within Streamlit for creating:
§ Live noise heatmaps.
§ Time-series plots of noise levels.
§ Frequency spectrum visualizations.
§ Distribution plots of noise levels across different zones.
· Data Transfer:
o HTTP / MQTT (from ESP32 to Python/Streamlit backend): For sending processed decibel values and spectral data from the edge devices to the central Python application.
· Data Storage (Local/Optional Cloud):
o CSV files / SQLite Database (Local): For temporary storage of data processed by Python before display or further analysis.
o Cloud Database (Optional, for scale): (e.g., InfluxDB for time-series, PostgreSQL, BigQuery) for long-term storage and historical trend analysis if a larger, distributed system is implemented.
Use Cases:
· Real-time Noise Level Monitoring: Provide live decibel readings across different urban zones, accessible via a central dashboard.
· Identification of Noise Hotspots: Visually highlight areas experiencing persistently high noise levels, helping to pinpoint problematic locations.
· Detection of Illegal Sound Events: Automatically alert authorities to sudden, unusual noise spikes (e.g., loud parties, unauthorized construction noise at night, excessively loud vehicles).
· Source Attribution (Advanced): Using more sophisticated audio analysis or ML, potentially identify the type of noise source (e.g., traffic, construction, industrial machinery, public events).
· Urban Planning & Zoning: Provide data-driven insights for designating quiet zones, planning green infrastructure (e.g., sound barriers, parks), and optimizing road networks to reduce noise impact.
· Regulatory Compliance & Enforcement: Help local governments monitor adherence to noise ordinances and gather evidence for enforcement.
· Public Health Research: Collect long-term data to study the correlation between noise pollution and public health outcomes (e.g., stress levels, sleep disturbances).
· Citizen Engagement: Provide an accessible platform for citizens to view local noise levels and report noise disturbances.
Benefits of the Project:
· Improved Quality of Life: Directly contributes to quieter and healthier urban environments, reducing stress and improving well-being for residents.
· Data-Driven Urban Planning: Enables city planners to make informed decisions based on empirical noise data rather than anecdotal evidence or outdated maps.
· Efficient Regulatory Enforcement: Provides real-time evidence for authorities to address noise violations promptly and effectively.
· Enhanced Public Health: Reduces exposure to harmful noise levels, which can lead to better sleep, reduced stress, and lower risk of cardiovascular issues.
· Sustainable Urban Development: Supports the creation of more sustainable and livable cities by addressing environmental noise.
· Cost-Effective Monitoring: Utilizes low-cost hardware and open-source software, making it an affordable solution for widespread deployment.
· Increased Transparency: Offers a transparent view of noise levels, empowering citizens and fostering accountability.
· Resource Optimization: Helps allocate resources for noise mitigation strategies more effectively by identifying priority areas.
Project 5: Urban Noise Pollution Intelligence System Codes:
🔗 View Project Code on GitHubConclusion and Suggestions:
This React application provides a visual simulation of the "Urban Noise Pollution Intelligence System" dashboard. It demonstrates how real-time noise levels across a city grid can be mapped and visualized, offering a dynamic overview of sound pollution and highlighting potential loud areas or sudden spikes.
To evolve this simulation into a fully functional and impactful system, consider the following next steps:
- Hardware Development: Build actual sensing nodes using ESP32 microcontrollers and MEMS microphones. Develop firmware that captures audio, performs real-time Fast Fourier Transform (FFT) for decibel calculation, and transmits this data efficiently.
- Backend for Data Ingestion & Analytics:
- Set up a robust data ingestion pipeline (e.g., using a message broker like MQTT or a cloud IoT service like Google Cloud IoT Core/AWS IoT Core) to collect data from many ESP32 nodes.
- Develop a Python backend to receive, store (e.g., in a time-series database like InfluxDB or a relational database like PostgreSQL), and process this continuous stream of noise data.
- Advanced Audio Analysis & ML:
- Beyond simple dB levels, explore using more sophisticated audio feature extraction (e.g., MFCCs) and machine learning models to classify sound events (e.g., distinguish between traffic noise, construction, music, human voices).
- Develop predictive models to forecast future noise levels or identify patterns indicating recurring issues.
- Real-time Dashboard with Streamlit: Use Streamlit (or a similar web framework) in conjunction with a real-time data source to build the actual interactive dashboard. This would allow for:
- Live heatmaps with actual sensor data.
- Time-series plots of noise levels over hours/days/weeks.
- Filtering data by zone, time of day, or noise event type.
- Integration with mapping libraries (e.g., Folium for Python, or Mapbox/Google Maps with React) to overlay noise data on a geographical map.
- Alerting Mechanisms: Implement real-time alerting for noise violations or sudden spikes, notifying relevant authorities or city management via SMS, email, or integrated dashboards.
- Integration with Urban Planning Tools: Explore ways to integrate the insights and data generated by this system directly into urban planning software or databases to inform zoning decisions, infrastructure projects, and the design of quiet zones.
- Public Portal: Develop a public-facing portal where citizens can view local noise levels, submit complaints, and access educational resources on noise pollution
6.Smart Parking Utilization & Dynamic Pricing Engine

Project Overview:
The Smart Parking Utilization & Dynamic Pricing Engine is an intelligent urban solution designed to revolutionize parking management in cities. This system integrates real-time data from various sensors—such as ultrasonic sensors to detect vehicle presence in a bay and RFID for vehicle identification—to provide an accurate, live view of parking slot occupancy. This continuous stream of usage data is ingested into a scalable cloud platform (AWS IoT and DynamoDB). Advanced analytics, including predictive models that leverage historical data like time-of-day and day-of-week patterns, are then employed to forecast parking demand. Based on these predictions and current occupancy, the system dynamically adjusts parking prices. The core objective is to optimize parking revenue for city authorities or private operators, significantly reduce traffic congestion caused by drivers searching for parking, minimize air pollution, and enhance the overall urban mobility experience by guiding drivers to available spots and fair pricing.
Skills Needed:
· IoT Hardware & Sensor Integration: Expertise in working with ultrasonic sensors (for presence detection) and RFID readers/tags (for vehicle identification), and integrating them with microcontrollers or edge devices.
· Embedded Systems Programming: Skills in programming microcontrollers (e.g., ESP32, Arduino) for data collection and communication.
· Networking & IoT Protocols: Strong understanding of MQTT for secure and efficient data transmission from parking sensors to the cloud.
· Cloud Platforms: In-depth knowledge of AWS services, particularly AWS IoT Core for device management, DynamoDB for fast, scalable NoSQL data storage, AWS Lambda for serverless processing, and potentially AWS S3 for data lake capabilities.
· Data Engineering: Skills in real-time data ingestion, processing, transformation, and management of streaming data from sensors.
· Machine Learning (ML) & Data Science: Strong background in developing and deploying predictive models (e.g., time-series forecasting, regression) to anticipate parking demand. Familiarity with Python and ML libraries (Scikit-learn, TensorFlow, PyTorch).
· Database Management: Experience with NoSQL databases like DynamoDB for handling high-throughput, low-latency data.
· Web/Mobile Development: For building a user-facing mobile app (e.g., React Native, Swift, Java) or web dashboard (e.g., React, Angular, Vue.js) to display available parking and pricing.
· DevOps & MLOps: Knowledge of CI/CD practices for deploying sensor firmware updates, cloud infrastructure, and analytical models.
· Payment Gateway Integration (Beneficial): Experience with integrating payment processing APIs for dynamic pricing.
· Urban Planning / Transportation Domain Knowledge (Beneficial): Understanding of traffic management, urban mobility, and parking policies.
Components & Technologies Used:
· Sensors:
o Ultrasonic Sensors (e.g., HC-SR04): Mounted above or at the entrance of each parking bay to detect the presence or absence of a vehicle by measuring the time it takes for a sound pulse to return.
o RFID Readers & Tags: (Optional, for more advanced tracking/identification) Tags can be placed on vehicles, and readers at parking bay entrances/exits can identify specific vehicles, enabling personalized pricing or subscription services.
· Edge Devices:
o Microcontrollers (e.g., ESP32, NodeMCU): Low-power, Wi-Fi enabled microcontrollers responsible for reading data from ultrasonic/RFID sensors, processing it (e.g., debouncing, filtering), and sending it to the cloud.
· Communication Protocol:
o MQTT: Lightweight messaging protocol for efficient and secure data transmission from edge devices (parking sensors) to AWS IoT Core.
· Cloud Platform (Amazon Web Services - AWS):
o AWS IoT Core: The central hub for connecting, managing, and ingesting data from thousands of parking sensors. Handles secure device authentication and messaging.
o AWS DynamoDB: A fast and flexible NoSQL database service used for storing real-time parking slot occupancy status (e.g., slot_id, status, timestamp, current_price). Its low-latency access is crucial for real-time updates.
o AWS Lambda: Serverless compute functions triggered by incoming sensor data (via IoT Core rules) to update DynamoDB and potentially trigger the dynamic pricing model.
o AWS Kinesis (Optional): For large-scale real-time streaming data ingestion before processing with Lambda or other services.
o AWS SageMaker: For building, training, and deploying the machine learning models that predict parking demand and determine dynamic pricing.
o AWS S3 (Simple Storage Service): For storing raw sensor data, historical parking patterns, and model artifacts as a data lake.
o AWS CloudWatch: For monitoring the performance and health of the entire system.
· Analytics & Machine Learning:
o Python: Primary language for developing the predictive models and data analysis scripts.
o Scikit-learn, Prophet, TensorFlow/PyTorch: ML libraries for developing time-series forecasting models (e.g., predicting occupancy levels for the next hour based on historical data) and optimization algorithms for dynamic pricing.
· User Interface (Optional):
o Web Dashboard / Mobile Application: A user-facing interface displaying real-time parking availability (e.g., map view with colored parking zones), current pricing, and estimated wait times.
Use Cases:
· Real-time Parking Availability: Drivers can instantly see available parking spots on a map via a mobile app or digital signage, reducing search time and frustration.
· Dynamic Pricing: Parking fees adjust automatically based on demand, time of day, day of week, and special events, maximizing revenue during peak times and incentivizing usage during off-peak hours.
· Traffic Congestion Reduction: By guiding drivers directly to available spots, the system reduces the number of vehicles circling for parking, alleviating urban congestion.
· Optimized Resource Allocation: Parking enforcement can be more efficient, targeting areas with high turnover or violations. Maintenance can be scheduled for less busy periods.
· Revenue Maximization: Cities or operators can significantly increase parking revenue through demand-based pricing.
· Enhanced Urban Mobility: Contributes to a smarter city infrastructure by improving the flow of traffic and pedestrian movement.
· Environmental Impact Reduction: Less idling time for vehicles reduces fuel consumption and carbon emissions.
· Smart City Integration: Can be integrated with broader smart city platforms for comprehensive urban management (e.g., linking with public transport data, traffic lights).
Benefits of the Project:
· Increased Revenue: Dynamic pricing maximizes income from parking spaces.
· Reduced Traffic Congestion: Drivers find parking faster, leading to smoother traffic flow.
· Improved User Experience: Convenience for drivers, less stress, and reduced wasted time searching for parking.
· Environmental Benefits: Lower fuel consumption and reduced emissions due to less cruising for parking.
· Optimized Infrastructure Usage: Ensures parking assets are utilized efficiently throughout the day.
· Data-Driven Decision Making: Provides valuable insights into parking patterns, helping urban planners make informed decisions about future infrastructure.
· Enhanced Public Safety: Reduced traffic congestion can improve response times for emergency services.
· Fairer Pricing: While dynamic, pricing can be perceived as fairer if it reflects actual demand and availability.
Project 6: Smart Parking Utilization & Dynamic Pricing Engine Codes:
🔗 View Project Code on GitHubConclusion and Suggestions:
This React application delivers a simulated dashboard for the "Smart Parking Utilization & Dynamic Pricing Engine" project, demonstrating how parking occupancy can be visualized across different zones and how dynamic pricing might adjust based on simulated demand.
To transform this simulation into a fully functional and valuable system, here are some comprehensive suggestions for next steps:
- Hardware Implementation: Develop and deploy actual parking sensors (ultrasonic for presence, potentially RFID for identification) at each parking bay. Design and program edge devices (e.g., ESP32) to collect sensor data and transmit it securely.
- AWS IoT Core Setup: Configure AWS IoT Core to register and manage all parking sensors, securely ingesting their real-time status updates via MQTT.
- Real-time Data Storage (DynamoDB): Set up DynamoDB tables to store the real-time status of each parking slot (e.g.,
slot_id,is_occupied,timestamp). Ensure efficient indexing for quick lookups. - Predictive Analytics with AWS SageMaker:
- Data Collection: Gather extensive historical parking data, including occupancy levels, time-of-day, day-of-week, special events, weather, and pricing.
- Model Training: Train time-series forecasting models (e.g., ARIMA, Prophet, or deep learning models) in SageMaker to predict parking demand for various zones and times.
- Dynamic Pricing Logic: Develop an optimization algorithm (can be part of the ML model or a separate Lambda) that uses the predicted demand and current occupancy to calculate optimal dynamic pricing for each zone/slot.
- Model Deployment: Deploy the predictive model as a SageMaker endpoint that can be invoked by Lambda functions.
- Real-time Dashboard Integration: Connect this React dashboard to your AWS backend to display actual real-time occupancy and dynamically calculated prices. This could involve WebSockets or periodic API calls to a backend service that queries DynamoDB.
- User-Facing Mobile Application: Develop a mobile application for drivers that integrates with the system. This app would show a map of available parking, current prices, estimated walk times, and allow for in-app payment.
- Payment Gateway Integration: Integrate a secure payment gateway (e.g., Stripe, PayPal, or a local payment provider) to handle dynamic parking payments.
- Traffic Management Integration: Explore integrating with city traffic management systems to provide holistic insights or even influence traffic light sequencing based on parking availability.
- Analytics & Reporting: Beyond the real-time view, build comprehensive dashboards (e.g., using AWS QuickSight or Power BI) for city administrators to analyze revenue, utilization trends, and policy effectiveness.
- Robust Security: Implement strong security measures across all layers, from device authentication to data encryption and access control, especially when dealing with payment information.

🚀 Ready to turn your passion for connected tech into real-world impact?
At Huebits, we don’t just teach IoT — we train you to build smart, scalable, and data-driven systems using the tech stacks powering today’s most innovative industries.
From edge devices to cloud platforms, you’ll gain hands-on experience designing end-to-end IoT architectures that collect, analyze, and respond in real time — built for deployment in cities, farms, factories, and homes.
🧠 Whether you're a student, aspiring IoT engineer, or future smart systems architect, our Industry-Ready IoT Engineering Program is your launchpad.
Master Python, Embedded C, MQTT, REST APIs, ESP32, Raspberry Pi, AWS IoT, Azure IoT Hub, and Grafana — all by building real-world IoT solutions that deliver results, not just data.
🎓 Next Cohort Starts Soon!
🔗 Join now and claim your seat in the IoT revolution powering tomorrow’s ₹1 trillion+ connected economy.
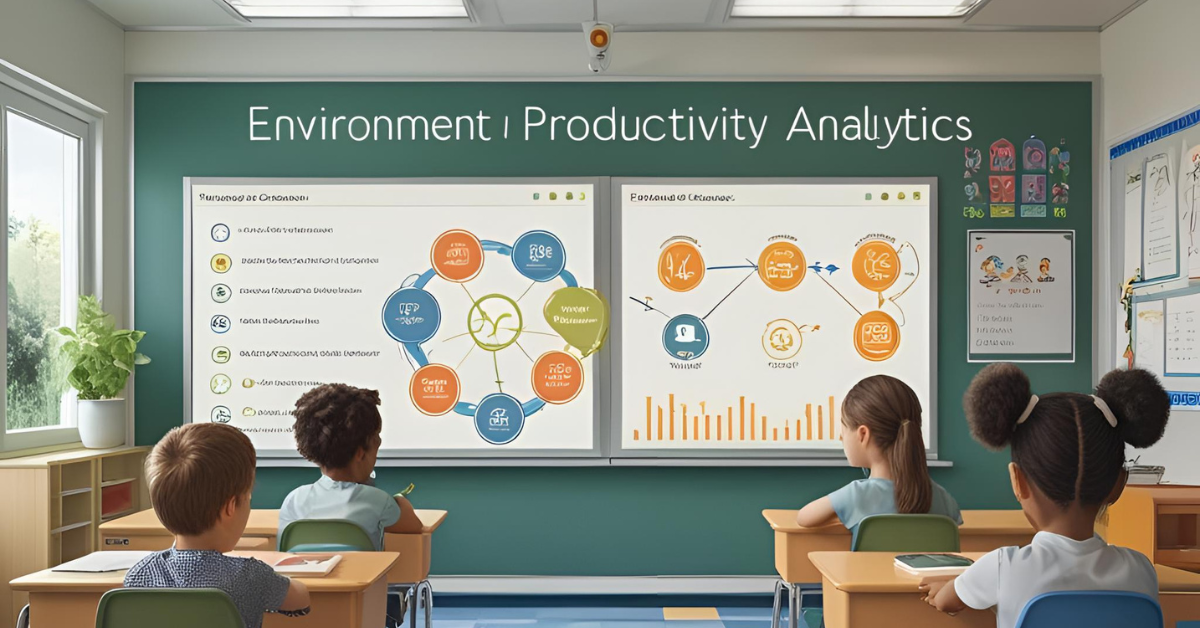
7.Smart Classroom Environment & Productivity Analytics
Project Overview:
The Smart Classroom Environment & Productivity Analytics system is an innovative solution designed to optimize learning environments by continuously monitoring key atmospheric and sensory parameters. This project deploys a network of intelligent sensors within classrooms to collect real-time data on temperature, CO2 levels, ambient lighting (Lux), and noise (dB). This environmental data is then processed and analyzed using advanced analytics, including machine learning models, to identify correlations between environmental conditions and student productivity (e.g., proxy metrics like engagement levels, attendance patterns, or even long-term academic performance if integrated with student data). The core objective is to provide educators and administrators with actionable insights to proactively adjust classroom variables, creating optimal conditions that enhance student focus, comfort, and overall learning outcomes, ultimately fostering more effective and engaging educational spaces.
Skills Needed:
· Educational Domain Knowledge (Beneficial): Understanding of learning theories, classroom management, and factors influencing student engagement and productivity.
· Embedded Systems & Hardware: Expertise with microcontrollers (e.g., ESP32, Raspberry Pi Zero W) and interfacing with various sensors (temperature, CO2, Lux, microphone for dB).
· Networking & IoT Protocols: Strong understanding of MQTT for efficient and secure data transmission from classroom sensors to the cloud.
· Cloud Platforms: In-depth knowledge of Microsoft Azure services, specifically Azure IoT Hub for device connectivity, Azure Stream Analytics for real-time data processing, Azure Data Lake or Azure SQL Database for storage, and Azure Machine Learning for model development.
· Data Engineering: Skills in real-time data ingestion, processing, transformation, and storage of streaming sensor data.
· Machine Learning (ML): Strong background in developing and deploying models for correlation analysis, anomaly detection, and potentially predicting optimal environmental settings. Familiarity with Python and ML libraries (Scikit-learn, TensorFlow, PyTorch).
· Data Visualization & Business Intelligence: Proficiency in creating interactive dashboards and reports using tools like Power BI or custom web frameworks, demonstrating the relationship between environmental factors and productivity metrics.
· DevOps: Knowledge of CI/CD practices for deploying sensor firmware updates, cloud infrastructure, and analytical models.
· Privacy & Data Ethics: Understanding of data privacy regulations (e.g., FERPA, GDPR) when dealing with classroom and student-related data, ensuring ethical data collection and usage.
· Communication & Collaboration: Ability to work effectively with educators, IT staff, and school administrators.
Components & Technologies Used:
· Sensors:
o Temperature Sensors (e.g., DHT11/22, BME280): To monitor ambient classroom temperature.
o CO2 Sensors (e.g., MH-Z19B, SCD30): To measure carbon dioxide levels, which can impact concentration and drowsiness.
o Lux Sensors (e.g., BH1750, TSL2561): To measure ambient light levels for assessing optimal brightness.
o dB Sensors (Microphone modules with amplifier, e.g., MAX9814/KY-038 with ESP32 FFT): To measure noise levels, identifying distractions or overly quiet environments.
· Edge Devices:
o Microcontrollers (e.g., ESP32, NodeMCU): Low-cost, Wi-Fi enabled microcontrollers responsible for reading sensor data, performing minor edge processing (e.g., aggregation, noise level calculation from raw audio), and securely transmitting data to the cloud.
· Communication Protocol:
o MQTT: Lightweight messaging protocol for efficient and secure data transmission from classroom sensors to Azure IoT Hub.
· Cloud Platform (Microsoft Azure):
o Azure IoT Hub: The central cloud gateway for connecting, monitoring, and managing IoT devices in classrooms. Securely ingests all sensor data.
o Azure Stream Analytics: Real-time stream processing engine to analyze incoming sensor data from IoT Hub, perform aggregations, and identify immediate environmental changes.
o Azure Functions / Azure Logic Apps: Serverless compute for triggering alerts (e.g., CO2 too high, room too hot), performing data transformations, or integrating with building management systems.
o Azure Data Lake Storage / Azure SQL Database: Scalable storage solutions for raw and processed historical environmental data.
o Azure Machine Learning: For building, training, and deploying predictive and correlation models to understand the impact of environmental variables on "productivity" metrics.
o Azure Time Series Insights (Optional): For advanced time-series data exploration and visualization.
· Analytics & Machine Learning:
o Python: Primary language for developing ML models and data analysis.
o Scikit-learn, Pandas, NumPy: ML and data manipulation libraries for:
§ Correlation Analysis: Identifying relationships between environmental factors and productivity.
§ Anomaly Detection: Pinpointing unusual environmental conditions.
§ Predictive Models: Forecasting optimal settings or potential productivity dips.
· Visualization & Dashboard:
o Power BI / Tableau / Custom Web Dashboard (e.g., React/Angular/Vue.js): Interactive dashboards displaying:
§ Real-time temperature, CO2, Lux, dB levels per classroom.
§ Historical trends for each parameter.
§ Visualizations of correlations between environmental factors and proxy productivity metrics.
§ Alerts for suboptimal conditions.
Use Cases:
· Real-time Environmental Monitoring: Provide educators and facilities staff with live data on classroom conditions.
· Optimal Environment Recommendation: Suggest ideal temperature, lighting, and CO2 levels based on historical data showing peak productivity.
· CO2 Level Management: Alert when CO2 levels are too high, prompting ventilation or breaks to improve air quality and student alertness.
· Lighting Optimization: Recommend adjustments to natural or artificial lighting based on external light conditions and desired brightness for tasks.
· Noise Disturbance Detection: Identify periods of excessive noise, helping to pinpoint disruptive activities or areas needing sound dampening.
· Energy Efficiency: Optimize HVAC and lighting systems by understanding actual classroom usage and environmental needs, reducing energy waste.
· Personalized Learning Environments (Future): Potentially tailor environmental settings to individual student needs or group preferences.
· Impact Assessment: Measure the effectiveness of changes made to classroom environments on student engagement and academic outcomes.
· Facility Planning: Inform decisions on new school builds or renovations to design more conducive learning spaces.
Benefits of the Project:
· Enhanced Student Productivity & Focus: Creating optimal conditions directly supports better concentration and learning.
· Improved Student Well-being & Comfort: Addresses physical discomforts that can distract from learning.
· Data-Driven Educational Management: Empowers educators and administrators with insights to improve classroom efficacy.
· Reduced Energy Consumption: Optimizes environmental controls, leading to lower utility bills for schools.
· Proactive Issue Resolution: Identifies and addresses environmental problems (e.g., poor ventilation, excessive noise) before they negatively impact learning.
· Safer & Healthier Classrooms: Ensures good air quality and comfortable temperatures, reducing health risks.
· Better Resource Allocation: Helps schools allocate resources more effectively for classroom improvements.
· Increased Stakeholder Engagement: Provides transparent data for parents, teachers, and students regarding the learning environment.
Project 7: Smart Classroom Environment & Productivity Analytics Codes:
🔗 View Project Code on GitHubConclusion and Suggestions:
This React application simulates the front-end dashboard for the "Smart Classroom Environment & Productivity Analytics" project. It visualizes real-time environmental data and provides a simplified "Classroom Comfort & Focus Index" along with actionable alerts.
To bring this project to life and build a fully functional system, consider these comprehensive next steps:
- Hardware Prototyping and Deployment: Develop actual sensor nodes using ESP32 or Raspberry Pi Zero W microcontrollers, integrating the specified temperature, CO2, Lux, and dB sensors. Program these devices to reliably collect data and securely transmit it.
- Azure IoT Hub and Data Ingestion: Set up Azure IoT Hub to act as the secure gateway for all sensor data. Configure device identities and ensure robust, scalable data ingestion.
- Real-time Data Processing with Azure Stream Analytics: Implement Azure Stream Analytics jobs to process the incoming raw sensor data streams. This would involve filtering, aggregating, and transforming the data into a clean, usable format for storage and analysis.
- Data Storage for Historical Analysis: Utilize Azure Data Lake Storage or Azure SQL Database to store historical sensor data. This rich dataset will be crucial for training and validating your machine learning models.
- Machine Learning Model Development (Azure Machine Learning):
- Data Collection: Gather actual classroom environmental data alongside proxy metrics for productivity (e.g., anonymized attendance, observed engagement levels, aggregated test scores over time).
- Correlation and Prediction: Train ML models (e.g., regression, time-series forecasting, or even reinforcement learning for optimal control) within Azure Machine Learning to:
- Identify strong correlations between specific environmental factors and productivity.
- Predict the "optimal" settings for different learning activities or student groups.
- Forecast potential dips in comfort or productivity based on environmental trends.
- Model Deployment: Deploy these trained models as web services in Azure Machine Learning, accessible by other Azure services for real-time inference.
- Automated Environmental Control Integration (Optional): Explore integrating with existing Building Management Systems (BMS) or smart HVAC/lighting systems to allow the system to automatically adjust classroom conditions based on the ML model's recommendations or alert triggers.
- Advanced Dashboard Features: Enhance the dashboard with:
- Historical Trends: Interactive charts (e.g., using Power BI or custom React charting libraries like Recharts) showing environmental trends over time.
- Correlation Visualizations: Graphs that clearly demonstrate the relationships discovered by the ML models.
- Classroom-specific Insights: The ability to view data for individual classrooms or compare performance across multiple rooms.
- Recommendation Engine: Display explicit recommendations for adjusting temperature, lighting, or ventilation.
- Alerting and Notification System: Implement Azure Functions or Azure Logic Apps to send automated alerts (e.g., email, SMS, or direct notifications to staff devices) when environmental conditions deviate significantly from optimal or critical thresholds are crossed (e.g., CO2 too high).
- Privacy and Data Ethics: Crucially, establish a strong framework for data privacy and ethics, especially if integrating any student-related data. Ensure all data is anonymized or de-identified, comply with regulations like FERPA or GDPR, and maintain transparency with all stakeholders (parents, teachers, students).
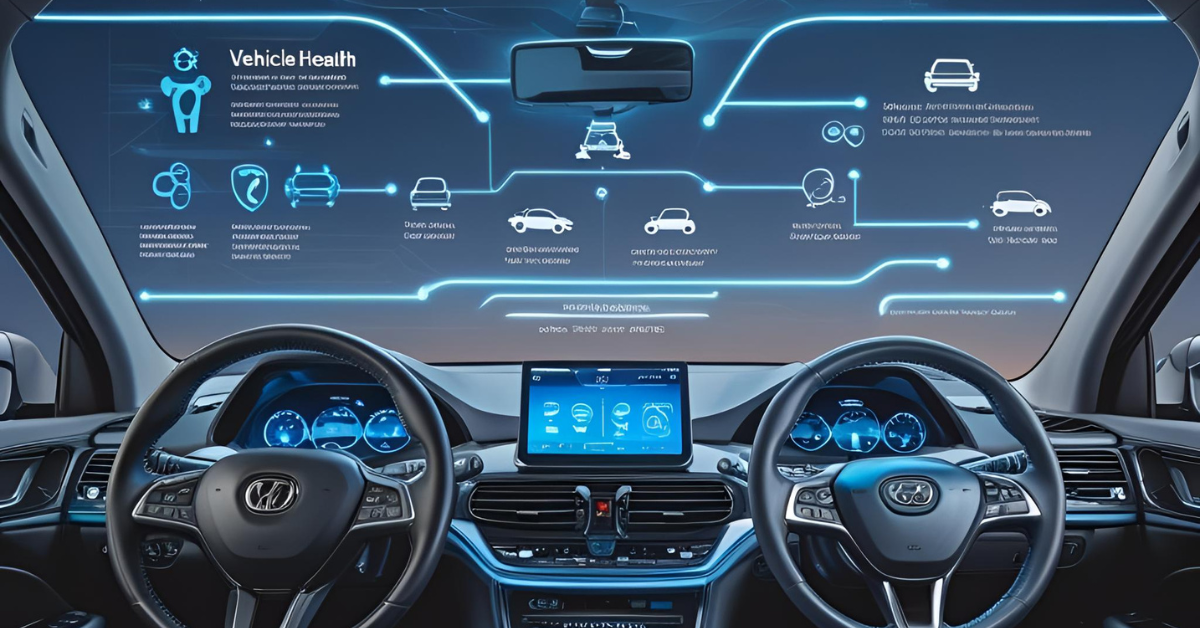
8.Vehicle Health & Driving Behavior Analytics
Project Overview:
The Vehicle Health & Driving Behavior Analytics system is an intelligent solution designed to enhance the safety, efficiency, and longevity of vehicle fleets, particularly in logistics, transportation, or ride-sharing industries. This project integrates real-time data from on-board diagnostics (OBD-II sensors) for vehicle health, accelerometers for motion and impact analysis, and GPS for location and routing. This rich, continuous stream of data is ingested into a scalable cloud platform (Google Cloud), where advanced analytics, including AutoML, are employed to predict vehicle maintenance needs and analyze individual driver patterns. The core objective is to provide fleet managers with actionable insights to proactively schedule maintenance, identify risky driving behaviors, and offer data-driven coaching. This ultimately leads to a significant reduction in accidents, optimized fuel consumption, lower maintenance costs, and improved overall fleet performance and safety.
Skills Needed:
· Automotive / Fleet Management Domain Knowledge: Understanding of vehicle mechanics, common maintenance issues, fleet operations, driver safety protocols, and fuel efficiency best practices.
· IoT Hardware & Sensor Integration: Expertise in working with OBD-II dongles/sensors, accelerometers, and GPS modules, and integrating them with edge devices (e.g., custom telematics units, Raspberry Pi).
· Embedded Systems Programming: Skills in programming microcontrollers or single-board computers for data collection, filtering, and secure transmission.
· Networking & IoT Protocols: Strong understanding of MQTT or HTTP for reliable and secure data transmission from vehicles to the cloud.
· Cloud Platforms: In-depth knowledge of Google Cloud Platform (GCP) services, specifically Google Cloud IoT Core for device management, Pub/Sub for real-time messaging, BigQuery for scalable data warehousing, and AutoML for machine learning.
· Data Engineering: Skills in real-time data ingestion, processing, transformation, and management of high-volume streaming data (time-series, geospatial, diagnostic codes).
· Machine Learning (ML) & Data Science: Strong background in developing and deploying predictive models (e.g., for fault prediction, anomaly detection, fuel efficiency) and clustering/classification models for driving behavior analysis. Experience with Python and ML frameworks (TensorFlow, PyTorch) for custom models, and particularly Google Cloud AutoML for simplified model building.
· Data Visualization & Dashboarding: Proficiency in building interactive dashboards using tools like Google Data Studio (Looker Studio) or custom web frameworks (React, Angular, Vue.js) to display real-time vehicle health, driver scores, and historical trends.
· Geospatial Data Processing: Skills in handling and visualizing GPS data for route analysis, geofencing, and driver behavior mapping.
· DevOps & MLOps: Knowledge of CI/CD practices for deploying firmware updates to telematics units, cloud infrastructure, and continuous integration/delivery of ML models.
· Cybersecurity: Understanding of securing IoT devices and data in transit and at rest, especially for sensitive vehicle and driver information.
Components & Technologies Used:
· Sensors & Edge Devices:
o OBD-II (On-Board Diagnostics) Sensors/Dongles: Connects to the vehicle's OBD-II port to extract real-time diagnostic trouble codes (DTCs), engine RPM, vehicle speed, fuel level, coolant temperature, and other performance parameters.
o Accelerometers (e.g., MPU6050, ADXL345): Measures acceleration in multiple axes to detect harsh braking, rapid acceleration, sharp turns, and impacts.
o GPS Modules: Provides precise location data, speed, and heading for route tracking, geofencing, and analyzing driving patterns in specific areas.
o Telematics Units / Edge Gateways (e.g., Raspberry Pi, custom industrial IoT gateways): Collects data from OBD-II, accelerometer, and GPS, performs edge processing (e.g., data aggregation, initial filtering, local anomaly detection), and transmits data to the cloud.
· Communication Protocol:
o MQTT / HTTP: Secure and efficient protocols for transmitting high-frequency data streams from vehicles to Google Cloud IoT Core.
· Cloud Platform (Google Cloud Platform - GCP):
o Google Cloud IoT Core: Manages device connectivity, authentication, and secure ingestion of data from thousands of fleet vehicles. (Note: IoT Core is being deprecated, migration to Device Registry with Pub/Sub recommended for new projects).
o Google Cloud Pub/Sub: Real-time messaging service for ingesting high-throughput streaming data from IoT Core (or directly from devices via other protocols) and distributing it to other GCP services.
o Google BigQuery: Highly scalable, serverless data warehouse for storing vast amounts of historical vehicle health data, driving behavior logs, and geospatial information. Excellent for analytical queries.
o Google Cloud Functions / Cloud Dataflow: Serverless compute or managed service for real-time stream processing, data transformation, and data enrichment (e.g., joining with vehicle metadata) before storing in BigQuery.
o Google Cloud Storage: For storing raw sensor data, historical logs, and machine learning model artifacts.
o Google Cloud AutoML: A powerful service that enables developers with limited ML expertise to train high-quality models using Google's transfer learning and neural architecture search. Ideal for accelerating the development of predictive maintenance and driving behavior models.
o Google AI Platform / Vertex AI: For advanced users to build, train, and deploy custom machine learning models.
· Dashboard & Visualization:
o Google Data Studio (Looker Studio): A free, web-based tool for creating interactive dashboards and reports directly from BigQuery data, visualizing vehicle health, driver scores, and geographical routes.
o Custom Web Dashboard (e.g., React, Angular, Vue.js): For more tailored UI/UX, integrating with Google Maps JavaScript API for live vehicle tracking and route visualization, and charting libraries (e.g., Chart.js, D3.js) for detailed analytics.
· Analytics & Machine Learning:
o Python: Primary language for custom ML models and data analysis scripts.
o Scikit-learn, TensorFlow/PyTorch: For building custom predictive models (e.g., predicting component failure, remaining useful life) and behavioral models (e.g., classifying aggressive vs. smooth driving).
Use Cases:
· Predictive Maintenance: Forecast potential vehicle component failures (e.g., battery degradation, engine issues, brake wear) based on OBD-II data, enabling proactive repairs and reducing costly breakdowns.
· Driver Safety Coaching: Analyze accelerometer data (harsh braking, rapid acceleration, sharp turns) and GPS data (speeding, unauthorized routes) to generate driver safety scores, identify risky behaviors, and provide targeted coaching.
· Fuel Efficiency Optimization: Monitor fuel consumption patterns, engine performance, and driving habits to identify inefficiencies and recommend strategies for reduced fuel usage.
· Route Optimization & Geofencing: Track vehicle locations to optimize routes, ensure adherence to designated areas (geofencing alerts), and improve delivery times.
· Accident Reconstruction & Analysis: In the event of an accident, leverage accelerometer and GPS data to reconstruct events, aiding investigations and insurance claims.
· Fleet Utilization & Dispatch: Provide real-time insights into vehicle availability, location, and operational status to optimize dispatching and asset utilization.
· Insurance Premium Adjustment: Data on safe driving behavior could be used by insurance companies to offer personalized premiums.
· Battery Health Monitoring (EV Fleets): Specifically for electric vehicles, monitor battery temperature, charge cycles, and degradation to predict range and replacement needs.
Benefits of the Project:
· Reduced Accidents & Improved Safety: Data-driven insights enable proactive driver coaching, reducing risky behaviors and preventing accidents.
· Lower Maintenance Costs: Predictive maintenance minimizes unexpected breakdowns, reduces emergency repairs, and extends the lifespan of vehicles.
· Optimized Fuel Consumption: Identifying inefficient driving habits and vehicle performance issues leads to significant fuel savings.
· Increased Fleet Uptime: Proactive maintenance and rapid issue identification keep more vehicles on the road, improving operational efficiency.
· Enhanced Driver Accountability & Performance: Drivers receive constructive feedback, promoting safer and more efficient driving practices.
· Data-Driven Decision Making: Fleet managers gain comprehensive insights to optimize routes, scheduling, staffing, and purchasing decisions.
· Reduced Operational Expenses: Combined benefits of lower maintenance, better fuel efficiency, and fewer accidents lead to substantial cost savings.
· Environmental Impact Reduction: Reduced idling, optimized routes, and better fuel efficiency contribute to lower carbon emissions.
· Better Insurance Rates: Demonstrable safety improvements can lead to lower insurance premiums for the fleet.
Project 8: Vehicle Health & Driving Behavior Analytics Codes:
🔗 View Project Code on GitHubConclusion and Suggestions:
This React application delivers a simulated dashboard for the "Vehicle Health & Driving Behavior Analytics" project. It provides a visual representation of key vehicle parameters, driver safety metrics, and location, giving you a sense of how a fleet manager's dashboard might operate.
To transform this simulation into a fully functional and valuable system, here are some comprehensive suggestions for next steps:
- Hardware Development & Deployment: Build or procure actual telematics units that integrate with OBD-II ports, accelerometers, and GPS modules. Develop firmware for these units to reliably collect, filter, and transmit data.
- Google Cloud IoT Core (or Pub/Sub with Device Registry) Setup: Configure the Google Cloud Platform to securely ingest data from thousands of vehicles. As noted in the Canvas, be aware of the deprecation of IoT Core and plan for Device Registry with Pub/Sub for new projects.
- Real-time Data Processing with Google Cloud Functions / Dataflow: Implement serverless functions or Dataflow pipelines to process the incoming high-volume data streams. This would involve parsing OBD-II codes, calculating metrics from accelerometer data, and enriching GPS data (e.g., with geofencing information).
- Data Warehousing with Google BigQuery: Store the processed and enriched data in BigQuery for scalable historical analysis. This will be the foundation for your machine learning models and detailed reporting.
- Machine Learning Model Development (Google Cloud AutoML / Vertex AI):
- Predictive Maintenance: Train models (e.g., using historical diagnostic codes, sensor anomalies, and maintenance records) to forecast potential component failures. AutoML can accelerate this if you have labeled data.
- Driving Behavior Analysis: Develop models to classify driving styles (e.g., aggressive, normal, cautious) or identify specific risky events based on accelerometer and GPS patterns.
- Dashboard Integration with Real Data: Connect this React dashboard to your GCP backend. This would involve setting up APIs (e.g., using Cloud Run or App Engine) that query BigQuery or real-time data streams to populate the dashboard with live vehicle data and ML-driven insights.
- Geospatial Visualization: Enhance the mapping component by integrating with Google Maps JavaScript API to display live vehicle locations on an actual map, show historical routes, and visualize geofence violations.
- Alerting and Notification System: Implement Cloud Functions to trigger alerts (e.g., SMS via Twilio, email, or push notifications to a mobile app) for critical vehicle health issues, severe driving infractions, or geofencing breaches.
- Driver Coaching Interface: Develop a separate interface or integrate into the main dashboard features for fleet managers to review individual driver performance, provide specific feedback, and track improvement over time.
- Robust Security & Data Privacy: Given the sensitive nature of vehicle and driver data, implement strong cybersecurity measures across all layers, including device authentication, data encryption, and strict access controls. Comply with all relevant data privacy regulations.

🔥 "Take Your First Step into the Internet of Things (IoT) Revolution!"
Ready to build the smart, connected systems that drive tomorrow’s homes, cities, farms, and industries?
Join the Huebits Industry-Ready IoT Program and gain hands-on experience with sensors, microcontrollers, IoT protocols, edge computing, and cloud platforms — using the exact tech stack trusted by leading IoT companies worldwide.
✅ Live Mentorship | 🌐 Real-World Projects | 📶 Career-Focused IoT Curriculum
9.Public Toilet Usage & Hygiene Analytics
Project Overview:
The Public Toilet Usage & Hygiene Analytics system is a smart city solution designed to significantly improve the management, cleanliness, and public health standards of urban public restrooms. This project deploys a network of discreet IoT sensors within public toilets, including Passive Infrared (PIR) sensors to detect occupancy, door switches to monitor entry/exit, and water flow meters to track toilet flushing and handwashing activity. Data collected from these sensors is processed by low-cost NodeMCU microcontrollers and then securely transmitted to a Firebase database. A Python-based analytics engine then processes this real-time and historical data to identify usage patterns, track cleaning schedule adherence, and detect anomalies that might indicate hygiene issues or potential maintenance needs. The core objective is to provide facility managers and cleaning staff with actionable insights, enabling them to optimize cleaning schedules, deploy staff more efficiently based on actual usage, ensure hygiene compliance, and ultimately enhance the user experience by maintaining consistently clean and well-serviced public facilities.
Skills Needed:
· IoT Hardware & Sensor Integration: Expertise in working with PIR sensors, magnetic door switches, and water flow meters, and integrating them with microcontrollers (e.g., NodeMCU, ESP32).
· Embedded Systems Programming: Skills in programming microcontrollers using Arduino IDE (C++) or MicroPython for sensor data acquisition and Wi-Fi communication.
· Networking & IoT Protocols: Understanding of MQTT or HTTP/HTTPS for secure data transmission from edge devices to Firebase.
· Backend Development (Firebase): Strong proficiency with Firebase services, including Firestore (NoSQL database) for storing real-time sensor data and usage logs, and Firebase Functions for serverless backend logic (e.g., processing data, sending alerts).
· Python Programming: Essential for data analysis, building the alert system, and potentially for data processing or reporting scripts.
· Data Analysis & Statistics: Skills in analyzing time-series data, identifying usage trends, and detecting anomalies (e.g., excessive or insufficient water flow, prolonged occupancy).
· Web/Mobile Development (Optional, for Dashboard/App): Frontend skills (e.g., React, HTML/CSS/JS) for building a management dashboard or a public-facing mobile application to show real-time status.
· DevOps: Knowledge of deploying and managing Firebase functions, and potentially firmware updates for NodeMCU devices.
· Facility Management / Public Health Domain Knowledge (Beneficial): Understanding of restroom hygiene standards, cleaning protocols, and public space management.
· Data Security & Privacy: Ensuring data collected (even if anonymous) is handled securely and ethically.
Components & Technologies Use:
· Sensors:
o PIR (Passive Infrared) Motion Sensors: To detect human presence inside a toilet stall or the restroom area, indicating usage.
o Door Switches (Magnetic Contact Sensors): To monitor the opening and closing of toilet stall doors or the main restroom entrance, providing entry/exit logs.
o Water Flow Meters: Installed on water lines to individual toilets/urinals and sinks to measure water consumption for flushing and handwashing, acting as a proxy for hygiene activities.
· Edge Compute:
o NodeMCU (ESP8266 or ESP32-based): Low-cost, Wi-Fi enabled microcontrollers suitable for connecting to multiple sensors, collecting data, and transmitting it to Firebase.
· Cloud Platform (Firebase):
o Firestore (Cloud Firestore): A flexible, scalable NoSQL cloud database for storing real-time sensor data (e.g., timestamp, sensor_id, event_type, water_volume, occupancy_status). Its real-time synchronization capabilities are beneficial for a dynamic dashboard.
o Firebase Realtime Database (Alternative/Complementary): Can also be used for very high-frequency, low-latency data updates.
o Firebase Functions: Serverless backend environment to:
§ Process incoming sensor data (e.g., aggregate flow meter readings, calculate usage duration).
§ Implement business logic (e.g., check cleaning schedule adherence).
§ Trigger alerts (e.g., send notifications to staff).
o Firebase Authentication: (Optional) If managing cleaning staff logins or public user access.
· Analytics & Alert System:
o Python: Used for:
§ Data retrieval from Firebase (for more complex batch analysis or reporting).
§ Developing analytical scripts to identify patterns (e.g., peak usage times, average water per flush, duration of occupancy).
§ Implementing an Alert System to notify staff via email, SMS (e.g., via Twilio integration), or a custom notification panel.
o Pandas / NumPy: Python libraries for data manipulation and analysis.
· Dashboard & Visualization (Optional):
o Web Framework (e.g., React, HTML/CSS/JS): To build an administrative dashboard displaying:
§ Real-time occupancy status of individual stalls.
§ Usage statistics (e.g., number of entries, average duration).
§ Water consumption per toilet/sink.
§ Cleaning schedule adherence.
§ Alerts for potential issues (e.g., low water flow, prolonged occupancy, missed cleaning).
o Charting Libraries (e.g., Chart.js, D3.js): For visualizing usage patterns over time.
Use Cases:
· Real-time Occupancy Monitoring: Displaying which toilet stalls are occupied or vacant, helping users find available facilities faster.
· Dynamic Cleaning Scheduling: Optimizing cleaning staff routes and timings based on actual usage intensity rather than fixed schedules, ensuring facilities are cleaned when most needed.
· Hygiene Compliance Tracking: Monitoring water flow to verify that toilets are flushed and hands are washed after use, indicating hygiene practices.
· Maintenance Anomaly Detection: Identifying issues like continuous water flow (leaks), excessively low water flow (clogs), or unusual occupancy patterns.
· Usage Pattern Analysis: Understanding peak usage hours, days, and specific facilities to inform resource allocation, stocking of supplies, and future infrastructure planning.
· Public Feedback Integration: Potentially integrating with a feedback mechanism where users can rate cleanliness, which can then be correlated with sensor data.
· Resource Management: More efficient use of cleaning supplies, water, and energy based on actual demand.
· Accessibility Monitoring: Tracking usage of accessible stalls to ensure they are available and properly maintained.
Benefits of the Project:
· Improved Public Hygiene & Cleanliness: Ensures restrooms are cleaned more effectively and frequently where needed, leading to better public health outcomes.
· Enhanced User Experience: Provides a more pleasant and convenient experience for citizens using public facilities, improving satisfaction.
· Optimized Cleaning Operations: Maximizes the efficiency of cleaning staff deployment, reducing idle time and ensuring resources are allocated where impact is greatest.
· Cost Savings: Reduces unnecessary cleaning frequency in low-usage areas and enables proactive maintenance, preventing costly repairs from prolonged issues (e.g., leaks).
· Data-Driven Facility Management: Empowers managers with concrete data to make informed decisions about cleaning schedules, supply restocking, and maintenance.
· Proactive Maintenance: Early detection of issues like leaks or clogs prevents larger problems and reduces repair costs.
· Increased Accountability: Provides objective data for monitoring cleaning staff performance and hygiene compliance.
· Sustainable Resource Use: Optimizes water usage by identifying inefficiencies or leaks, contributing to environmental sustainability.
Project 9: Public Toilet Usage & Hygiene Analytics Codes:
🔗 View Project Code on GitHubConclusion and Suggestions:
This React application delivers a simulated dashboard for the "Public Toilet Usage & Hygiene Analytics" project. It vividly demonstrates how real-time occupancy, cleanliness status, and alerts for individual stalls and the overall facility can be visualized, providing a powerful tool for facility managers.
To evolve this simulation into a fully functional and impactful system, here are some comprehensive suggestions for next steps:
- Hardware Implementation: Develop and deploy actual sensor units (PIR, door switches, water flow meters) in public toilet stalls. Program NodeMCU/ESP32 microcontrollers to collect this data accurately and securely transmit it over Wi-Fi.
- Firebase Backend Development:
- Firestore Data Model: Design a robust Firestore data model to efficiently store sensor events, stall status, usage logs, and cleaning records. Utilize Firebase's real-time capabilities.
- Firebase Functions: Implement Firebase Functions to:
- Ingest raw sensor data, perform initial processing (e.g., debouncing, aggregation).
- Update stall statuses (occupied, vacant, needs_cleaning).
- Calculate cleaning scores based on usage and time since last cleaning.
- Detect anomalies (e.g., prolonged occupancy, continuous water flow, low water flow) and set appropriate alerts.
- Manage cleaning schedules and check for adherence.
- Python Analytics Engine: Develop a Python backend (which could run as a Cloud Function or a separate service) to:
- Retrieve historical data from Firestore for deeper analysis.
- Identify long-term usage patterns (e.g., peak hours/days, average usage duration per stall).
- Build predictive models (e.g., for forecasting busiest times, predicting when a stall will need cleaning based on usage).
- Generate comprehensive reports on hygiene compliance and resource utilization.
- Alert System Integration: Use Firebase Functions to trigger real-time alerts. This could involve:
- Sending SMS notifications to cleaning staff (via Twilio integration).
- Pushing notifications to a dedicated mobile app for staff.
- Displaying critical alerts prominently on the management dashboard.
- Sending email summaries to facility managers.
- Advanced Dashboard Features: Enhance the React dashboard to:
- Display historical usage trends using interactive charts (e.g., daily/hourly usage, average water consumption per user).
- Show a schedule view for cleaning, highlighting missed cleanings or upcoming requirements.
- Allow cleaning staff to manually update a stall's status to "cleaning in progress" and "cleaned" from the dashboard or a simple mobile interface.
- Incorporate a public-facing view showing only vacant/occupied status to help users.
- User Management (Firebase Authentication): Implement Firebase Authentication to secure access for facility managers and cleaning staff, ensuring only authorized personnel can view detailed data or trigger actions.
- Data Security & Privacy: Ensure all data collected and stored is anonymized where possible, encrypted in transit and at rest, and adheres to relevant privacy regulations. The system should focus on usage patterns, not individual user tracking.
- Integration with Smart City Platforms: Explore possibilities of integrating this system with broader smart city infrastructure for a more holistic view of urban services.
10.Smart Grid Load Forecasting & Outage Prediction
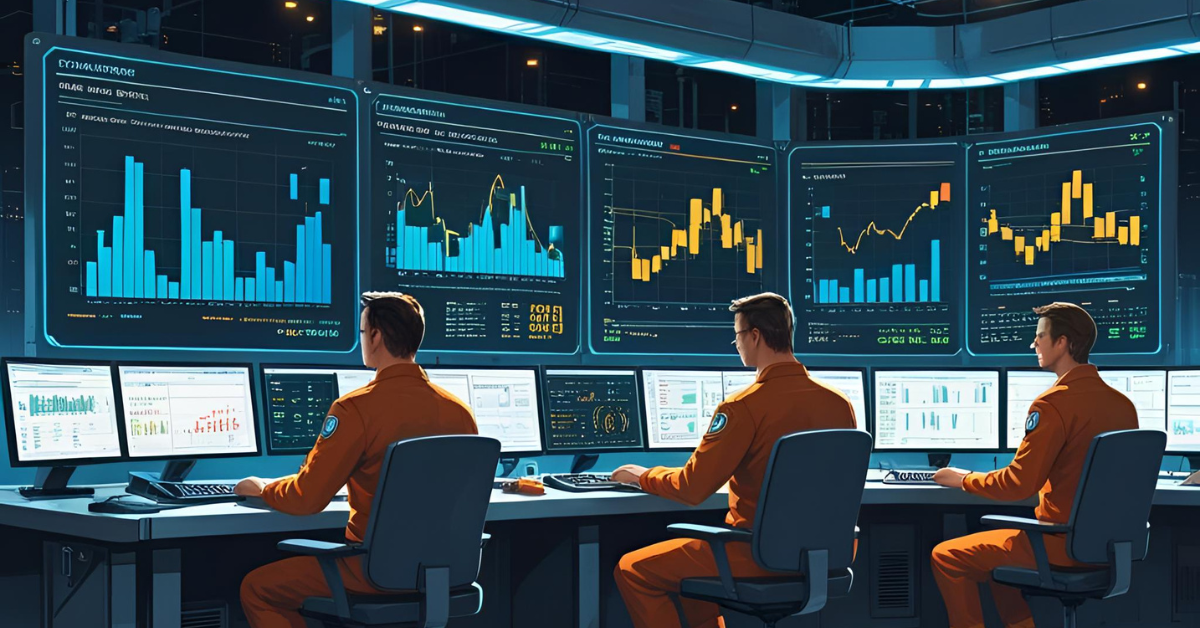
Project Overview:
The Smart Grid Load Forecasting & Outage Prediction system is a critical infrastructure solution designed to enhance the reliability, efficiency, and resilience of modern electricity grids. This project leverages real-time data from various intelligent sensors across the grid, including smart meters (for consumption data), line vibration sensors (for detecting physical anomalies on power lines), and voltage sensors (for monitoring grid stability). This continuous stream of operational data is securely ingested into a robust cloud platform (Azure IoT Hub), and then analyzed using specialized time-series analytics services (Azure Time Series Insights). At its core, the system employs advanced deep learning models, specifically Long Short-Term Memory (LSTM) networks, for highly accurate electricity demand forecasting and proactive detection of potential outage risks. The primary objective is to empower grid operators with predictive insights, enabling them to optimize electricity load distribution across zones, anticipate and prevent blackouts, reduce operational costs, and ultimately ensure a more stable and efficient power supply for communities.
Skills Needed:
· Electrical Engineering & Grid Operations Domain Knowledge: Deep understanding of power distribution systems, grid dynamics, load balancing, fault detection, and common causes of outages.
· IoT Hardware & Sensor Integration: Expertise in working with smart meters, vibration sensors, and voltage/current sensors, and integrating them with grid-hardened edge devices or RTUs (Remote Terminal Units).
· Embedded Systems/SCADA/RTU Programming: Skills in programming industrial-grade edge devices for data acquisition from grid infrastructure.
· Networking & Industrial IoT Protocols: Strong understanding of industrial communication protocols (e.g., Modbus, DNP3) and IoT protocols (e.g., MQTT, AMQP) for secure and reliable data transmission from grid assets to the cloud.
· Cloud Platforms: In-depth knowledge of Microsoft Azure services, specifically Azure IoT Hub for secure device connectivity and data ingestion, Azure Stream Analytics for real-time processing, Azure Data Lake for storage, and especially Azure Time Series Insights for specialized time-series data analysis and visualization.
· Data Engineering: Skills in real-time streaming data ingestion, processing, transformation, and management of high-volume, high-velocity time-series data from industrial IoT sources.
· Machine Learning (ML) & Deep Learning: Strong background in developing and deploying time-series forecasting models, particularly Long Short-Term Memory (LSTM) networks and other recurrent neural networks (RNNs). Experience with Python and deep learning frameworks (TensorFlow, PyTorch).
· Data Visualization & Business Intelligence: Proficiency in creating interactive dashboards and reports using tools like Power BI or custom web frameworks, specifically for visualizing complex time-series data, forecasts, and outage alerts.
· DevOps & MLOps: Knowledge of CI/CD practices for deploying edge device firmware updates, cloud infrastructure, and continuous integration/delivery of ML models in an industrial context.
· Cybersecurity (Industrial Control Systems - ICS): Critical understanding of cybersecurity best practices for protecting operational technology (OT) and industrial control systems (ICS) from cyber threats.
Components & Technologies Used:
· Sensors & Grid Devices:
o Smart Meters: Advanced metering infrastructure (AMI) providing granular, real-time electricity consumption data from homes and businesses.
o Line Vibration Sensors: Accelerometers or vibration sensors attached to power transmission lines to detect abnormal oscillations, ice buildup, or potential structural damage.
o Voltage/Current Sensors: Located at various points in substations and distribution lines to monitor real-time voltage and current levels, indicating load changes, anomalies, or potential faults.
o Fault Detectors & Indicators: Devices deployed along distribution lines that signal when a fault (e.g., short circuit) has occurred.
· Edge Compute / RTUs:
o Remote Terminal Units (RTUs) / Industrial IoT Gateways: Ruggedized devices deployed at substations or along lines to collect data from various sensors, perform local aggregation, filtering, and protocol translation, and transmit data securely to the cloud.
· Communication Protocols:
o Industrial Protocols (e.g., Modbus, DNP3, IEC 61850): Used for communication between grid devices and RTUs.
o MQTT / AMQP: For secure and efficient data transmission from RTUs/gateways to Azure IoT Hub over standard network connections.
· Cloud Platform (Microsoft Azure):
o Azure IoT Hub: The highly scalable, secure cloud gateway for ingesting telemetry data from thousands of grid devices and managing their connectivity.
o Azure Stream Analytics: Real-time stream processing engine to analyze high-velocity data from IoT Hub, perform aggregations, windowing, and anomaly detection for immediate insights.
o Azure Time Series Insights (TSI): A fully managed analytics platform optimized for IoT time-series data. It provides fast path analysis, storage, and visualization capabilities for exploring and querying historical and real-time sensor data, crucial for grid analytics.
o Azure Data Lake Storage: For storing raw telemetry data, historical forecasts, and model training datasets at scale.
o Azure Databricks / Azure Machine Learning: For building, training, and deploying advanced LSTM-based time-series forecasting models and outage prediction models. Databricks can handle large-scale data processing for model training.
o Azure Functions / Azure Logic Apps: Serverless compute for triggering alerts (e.g., SMS for detected outages, email for high load forecasts), integrating with other grid management systems, or sending control commands back to the grid (securely).
o Azure Event Hubs (Complementary): For high-throughput event streaming.
· Analytics & Machine Learning (Deep Learning):
o Python: Primary language for developing LSTM models.
o TensorFlow / Keras / PyTorch: Deep learning frameworks for building and training LSTM networks that excel at capturing complex temporal dependencies in electricity demand and grid health data.
o Scikit-learn: For pre-processing data and potentially for simpler baseline models.
· Visualization & Dashboard:
o Power BI / Custom Web Dashboard: Interactive dashboards displaying:
§ Real-time electricity demand vs. supply across zones.
§ Load forecasts (short-term, medium-term).
§ Identified anomalies (e.g., unusual voltage drops, high vibration).
§ Probabilistic outage predictions.
§ Historical performance and outage events.
Use Cases:
· Accurate Load Forecasting: Predict electricity demand at various granularities (e.g., hourly, daily, weekly, per substation/zone) to optimize generation, transmission, and distribution.
· Proactive Outage Prediction: Identify conditions indicative of impending outages (e.g., unusual line vibrations, sustained voltage dips, equipment overheating trends) to allow for preemptive maintenance or rerouting.
· Optimized Load Distribution: Dynamically adjust power flow across different parts of the grid to prevent overload in specific zones and ensure balanced distribution.
· Renewable Energy Integration: Better forecast and manage fluctuating supply from renewable sources (solar, wind) by predicting overall grid demand.
· Energy Trading Optimization: More accurate load forecasts support better bidding and trading strategies in electricity markets.
· Fault Localization & Restoration: While not direct prediction, insights into grid health can aid in faster identification and restoration after an outage.
· Demand Response Management: Facilitate demand response programs by accurately predicting peak demand periods where consumption reduction incentives can be most effective.
· Asset Management: Predict wear and tear on grid components (transformers, lines) to schedule maintenance effectively and extend asset lifespan.
Benefits of the Project:
· Reduced Blackouts & Service Disruptions: Proactive prediction and prevention of outages significantly improves grid reliability and continuity of power supply.
· Optimized Grid Operations: More accurate forecasting leads to efficient generation, transmission, and distribution of electricity, reducing waste.
· Cost Savings: Minimized unexpected equipment failures, optimized fuel consumption for power plants, and reduced need for costly emergency repairs.
· Enhanced Grid Resilience: The ability to anticipate and respond to adverse conditions makes the grid more robust against unforeseen events and climate impacts.
· Improved Energy Efficiency: Better load balancing and reduced line losses contribute to overall energy efficiency.
· Facilitates Renewable Energy Adoption: More accurate forecasting helps utilities better integrate intermittent renewable energy sources into the grid.
· Data-Driven Decision Making: Empowers grid operators with real-time and predictive intelligence for critical operational and strategic decisions.
· Increased Public Safety: A more stable grid reduces risks associated with power fluctuations and outages.
· Environmental Benefits: Efficient energy use and reduced reliance on peak power generation (often from fossil fuels) contribute to lower carbon emissions.
Project 10: Smart Grid Load Forecasting & Outage Prediction Codes:
🔗 View Project Code on GitHubConclusion and Suggestions:
This React application delivers a simulated dashboard for the "Smart Grid Load Forecasting & Outage Prediction" project. It provides a visual representation of key grid parameters like current load, load forecast, voltage, and line vibration, along with a simulated grid health status and potential outage alerts.
To evolve this simulation into a fully functional and robust system, here are some comprehensive suggestions for next steps:
- Real Grid Data Integration: Establish secure communication channels (using industrial protocols like Modbus, DNP3, IEC 61850 with RTUs/gateways, then MQTT/AMQP to cloud) to ingest actual real-time data from smart meters, line vibration sensors, and voltage/current sensors into Azure IoT Hub.
- Azure Time Series Insights (TSI) Implementation: Fully leverage TSI for storing, querying, and visualizing the high-volume time-series grid data. Use its explorer for ad-hoc analysis and debugging.
- Advanced LSTM Model Development: Train sophisticated LSTM models (using Python with TensorFlow/PyTorch) within Azure Databricks or Azure Machine Learning. These models should ingest historical grid data, weather patterns, historical outages, and events to:
- Provide highly accurate load forecasts (short-term, medium-term).
- Predict the probability and location of potential outages based on anomalies (voltage dips, unusual vibrations, fault detector triggers) and their correlation with past events.
- Real-time Stream Processing (Azure Stream Analytics): Develop complex Stream Analytics jobs to perform real-time aggregations, windowing functions, and anomaly detection on the incoming data streams from IoT Hub before feeding them to TSI and ML models.
- Alerting and Control Integration: Implement Azure Functions/Logic Apps to trigger automated alerts (SMS, email, or integration with SCADA/DMS systems) for predicted outages, critical load conditions, or severe anomalies. Securely implement logic for sending control commands back to the grid (e.g., for load shedding, rerouting power).
- Comprehensive Power BI Dashboard: Create detailed Power BI dashboards that go beyond the simulation, offering:
- Interactive maps of the grid showing real-time load, voltage, and health status per zone.
- Comparison of forecasted vs. actual load.
- Visualizations of historical outage events and their root causes.
- Drill-down capabilities for specific substations or lines.
- Cybersecurity Hardening: Given the critical nature of grid infrastructure, implement stringent cybersecurity measures across all layers, from edge devices to cloud services, adhering to industrial control system (ICS) security best practices.
- Integration with Existing Grid Management Systems: Seamlessly integrate the insights and control capabilities of this system with existing SCADA (Supervisory Control and Data Acquisition) and DMS (Distribution Management System) platforms used by grid operators.
🎯 Conclusion
IoT Analytics is no longer a luxury — it’s a competitive edge. In an increasingly connected world, raw data, while abundant, offers limited value on its own. The true power emerges when this data is subjected to rigorous analysis, revealing hidden patterns, predicting future states, and enabling proactive decision-making. This capability is rapidly becoming the differentiator for businesses, cities, and even individuals.
Whether you’re passionate about hacking hardware to collect granular data from the physical world, or skilled in wrangling complex data streams through sophisticated cloud pipelines, these projects offer a unique opportunity to flex both your engineering grit and analytical genius. They demand a blend of hands-on device management, robust cloud architecture, and insightful data science, culminating in solutions that have tangible, real-world impact.
The journey through these IoT analytics projects showcases how seemingly disparate pieces of information—a temperature reading, a sound wave, a vehicle's RPM—can be transformed into actionable intelligence. This intelligence allows us to:
· Anticipate and mitigate disasters, saving lives and property.
· Create healthier urban environments by understanding and managing pollution.
· Optimize resource allocation in critical sectors like healthcare and transportation.
· Enhance efficiency and reduce waste across industries.
· Drive innovation that reshapes how we interact with our surroundings.
💡 Want to future-proof your career? The demand for professionals who can bridge the gap between physical devices and intelligent insights is skyrocketing. Mastering the technologies and methodologies presented in these projects will position you at the forefront of the next wave of technological innovation.
Start building. Start analyzing. Start leading. The future of interconnected intelligence is yours to shape.

🚀 About This Program — Internet of Things (IoT) Engineering
By 2030, it won’t be just people online — everything will be. From smart homes to connected cities, autonomous farms to self-healing factories, the Internet of Things (IoT) is becoming the digital nervous system of our world. Every light that adapts, every machine that predicts failure, every wearable that senses vitals — it’s all IoT, and it’s all real.
🛠️ The problem? Most IoT training is stuck in 2015. Boring dashboards. Cookie-cutter Arduino kits. Zero context for production-scale systems. The industry doesn’t need tinkerers — it needs systems engineers, data-driven architects, and full-stack IoT builders who can code, connect, and deploy across the entire spectrum — from edge devices to the cloud.
🔥 That’s where Huebits rewrites the rulebook.
We don’t train you to understand IoT.
We train you to build intelligent, connected systems that solve real-world problems.
Welcome to a 6-month, hands-on, Industry-Calibrated IoT Engineering Program — built to make you deployment-ready from Day One. Whether it’s building smart sensor networks, deploying AI at the edge, or creating cloud-connected automation systems, this program gives you the power to architect the future.
From mastering Embedded C, Python, and MQTT, to working with ESP32, Raspberry Pi, STM32, and deploying live systems with AWS IoT, Azure IoT Hub, and Grafana — we turn your curiosity into capabilities.
🎖️ Certification That Speaks Tech
Graduate with a Huebits-Certified IoT Engineer Credential, validated by tech leaders, IoT startups, and enterprise partners. This isn’t some paper souvenir — it’s industry-backed proof that you can build, optimize, and ship end-to-end IoT systems at scale.
📌 Why This Program Hits Harder:
✅ Real-World Edge-to-Cloud Projects
✅ Hands-on Hardware & Sensor Labs
✅ Live Debugging Sessions + Firmware Flashing
✅ LMS Access for One Full Year
✅ Job Guarantee After Successful Completion
💥 Your future team doesn’t want textbook definitions of MQTT or GPIO — they want someone who can get a fleet of devices online, secured, and generating business value in hours, not weeks.
Let’s build that engineer. Let’s build you.
🎯 Join Huebits’ Industry-Ready IoT Engineering Program
and shape the world — one smart device, one data packet at a time.
🔥 "Take Your First Step into the Internet of Things (IoT) Revolution!"
Ready to build the smart, connected systems that drive tomorrow’s homes, cities, farms, and industries?
Join the Huebits Industry-Ready IoT Program and gain hands-on experience with sensors, microcontrollers, IoT protocols, edge computing, and cloud platforms — using the exact tech stack trusted by leading IoT companies worldwide.
✅ Live Mentorship | 🌐 Real-World Projects | 📶 Career-Focused IoT Curriculum