🛠️ The Top 10 ETL Projects to Master in 2025

📊 Introduction: Why ETL Matters More Than Ever in 2025
In 2025, the notion of data as a mere byproduct has long been discarded; it is now unequivocally the currency of innovation. From the meticulous operations of real-time health monitoring systems that track vital signs in milliseconds, to the intricate logic powering automated retail forecasting engines that predict consumer demand with unprecedented accuracy, ETL (Extract, Transform, Load) pipelines stand as the unseen, yet indispensable, backbone of every intelligent system.
Whether you're orchestrating the migration of petabytes across sprawling cloud data lakes, or meticulously cleansing chaotic API responses to feed a cutting-edge machine learning model, ETL is the alchemical process by which raw, disparate data is meticulously refined and transmuted into decision-ready intelligence. It's the critical bridge between data accumulation and actionable insight.
But here’s the crucial twist that defines the current landscape: the industry is no longer merely seeking "data enthusiasts." The demand has shifted dramatically towards builders — individuals who possess the rare blend of theoretical understanding and practical acumen to engineer pipelines that are robust, inherently scalable, and truly production-grade. Companies are looking for those who can move beyond conceptual diagrams to deploy solutions that perform reliably under immense pressure, consistently deliver high-quality data, and can evolve with the ever-changing demands of the business.
This blog isn’t merely a compendium of ideas. It is designed as your definitive blueprint to becoming an ETL architect. We've painstakingly handpicked 10 project ideas, each meticulously crafted to blend real-world complexity with immediate, hands-on relevance. These aren't academic exercises; they are tangible, impactful projects that are perfect for fortifying your portfolio, enriching your resume, or adding substantial depth to your GitHub README.
Whether you aspire to be a trailblazing data engineer, a cutting-edge machine learning practitioner, or a foundational backend developer — these are the projects that will demonstrably prove your capability to move data with intent and intelligence. They showcase not just what you know, but what you can build and deliver in a rapidly accelerating data economy.
"Let’s build, and in doing so, redefine the future of data"
Further Considerations for 2025 Context:
- Rise of Real-time & Streaming: The emphasis on "real-time" isn't just a buzzword; it's a fundamental shift. Traditional batch ETL is still relevant for certain use cases, but event-driven architectures, Kafka, Flink, and other streaming technologies are now central to modern ETL.
- Cloud-Native and Serverless: The pervasive adoption of cloud platforms (AWS, Azure, GCP) means ETL pipelines are increasingly leveraging serverless functions, managed services (e.g., AWS Glue, Azure Data Factory, GCP Dataflow), and auto-scaling capabilities. Building for cost-efficiency and elasticity in the cloud is paramount.
- Data Mesh and Data Fabric Architectures: Organizations are moving towards decentralized data ownership and consumption. ETL architects need to understand how their pipelines fit into these broader architectural paradigms, often involving data products, self-service capabilities, and robust data governance.
- AI/ML Integration: ETL is no longer just about moving data for reporting. It's about preparing and delivering data optimized for machine learning models, often involving feature engineering directly within the pipeline, and sometimes even incorporating ML-driven anomaly detection or quality checks within the ETL process itself.
- Data Governance and Observability: With increasing regulatory scrutiny and the sheer volume of data, robust data governance (metadata management, data lineage, quality checks) and observability (monitoring, alerting, logging) are non-negotiable aspects of production-grade ETL.
- Low-Code/No-Code Tools vs. Custom Code: While many commercial tools offer low-code/no-code ETL, the ability to write custom, optimized code (Python, Scala) for complex transformations, custom connectors, and performance tuning remains a highly valued skill for "builders."
- DataOps: The principles of DataOps, bringing DevOps methodologies to data, are essential. This includes automation of testing, deployment, and monitoring of ETL pipelines, fostering collaboration between data engineers, data scientists, and operations teams.
Table of Content:
🔄 1. Real-Time Crypto Market Tracker
📌 Project Overview:
The Real-Time Crypto Market Tracker is a robust and scalable ETL (Extract, Transform, Load) pipeline engineered to continuously ingest live cryptocurrency price data from various exchanges. This ingested raw data undergoes real-time transformation into actionable insights, which are then meticulously visualized on a dynamic, live dashboard. The project serves as a practical, hands-on simulation of the complex infrastructure that underpins leading trading platforms and advanced fintech dashboards, demonstrating their operational capabilities at scale. Its core objective is to provide immediate, up-to-the-second market intelligence, enabling users to react swiftly to price fluctuations and market momentum.
⚙️ Tech Used:
- Language: Python
- Rationale: Python's extensive ecosystem, rich libraries, and ease of use make it an ideal choice for data engineering, real-time data processing, and web application development (via Streamlit). Its strong community support and readability contribute to efficient development and maintenance.
- Streaming Source: WebSocket APIs (Binance, Coinbase)
- Rationale: WebSocket APIs are crucial for real-time data streaming due to their persistent, full-duplex communication channels. Unlike traditional HTTP requests, WebSockets maintain an open connection, allowing immediate push notifications of price changes, volume updates, and other market events without constant polling. This ensures minimal latency and high data freshness.
- Database: PostgreSQL
- Rationale: PostgreSQL is chosen for its robust support for time-series data, advanced indexing capabilities (e.g., BRIN, GiST for time-based queries), and its reliability as a relational database. It provides ACID compliance, ensuring data integrity for financial information. Its ability to handle large volumes of data and complex queries makes it suitable for storing historical price snapshots and calculated metrics.
- Visualization: Streamlit
- Rationale: Streamlit allows for rapid development of interactive web applications and dashboards purely in Python, eliminating the need for front-end development expertise (HTML, CSS, JavaScript). It's ideal for quickly prototyping and deploying data applications, making it perfect for a live, real-time market tracker where immediate visual feedback is paramount.
Libraries:
- Pandas: Essential for data manipulation and analysis, particularly for handling time-series data, cleaning, aggregation, and preparing data for visualization.
- SQLAlchemy: Provides an Object-Relational Mapper (ORM) that simplifies interaction with the PostgreSQL database, allowing developers to work with Python objects instead of raw SQL queries, improving code readability and maintainability.
- websockets: A low-level library for building WebSocket clients and servers in Python, enabling efficient and reliable communication with cryptocurrency exchange APIs.
- datetime: Python's built-in module for handling dates and times, crucial for timestamping data, calculating time-based metrics (e.g., rolling averages), and managing data retention policies.
💼 Use Cases:
- Crypto Trading Dashboards: The core application, offering retail and institutional traders a live view of market movements, empowering informed decision-making.
- Real-Time Financial Alerts: Triggers for price thresholds, significant volume changes, or sudden market shifts, delivered via email, SMS, or in-app notifications.
- AI-Based Trading Bot Triggers: The real-time data stream and calculated indicators can directly feed into automated trading algorithms, enabling quick execution of buy/sell orders based on predefined strategies.
- Market Volatility Analysis: Provides the foundational data to analyze and visualize market volatility, helping traders and analysts understand risk and potential price swings.
- Educational Dashboards for Financial Literacy Platforms: Offers a practical, interactive tool for students and learners to observe real-world market dynamics without financial risk, fostering a deeper understanding of financial concepts.
- Algorithmic Strategy Backtesting: The stored historical data in PostgreSQL can be leveraged to backtest various trading strategies, optimizing parameters before live deployment.
- Regulatory Compliance & Auditing: The timestamped data can serve as an immutable record of market activity, aiding in compliance reporting and auditing processes.
📈 Impact / ROI:
- Delivers Instant Insights into Crypto Price Swings: By processing and visualizing data in real-time, users gain immediate awareness of market shifts, allowing for proactive responses. This direct impact on decision-making can lead to improved trading outcomes.
- Enables Latency-Aware Trading Models: The low-latency data pipeline is critical for high-frequency trading (HFT) and algorithmic strategies where even milliseconds matter. This project provides the foundational infrastructure for developing and deploying such models.
- Boosts User Engagement on Finance Platforms Through Real-Time Metrics: Interactive and dynamic dashboards featuring live data significantly enhance user experience, leading to increased time spent on platforms and higher retention rates.
- Can be Monetized as a Backend for Fintech Dashboards or Crypto Tools: The robust ETL pipeline can be offered as an API service to other financial applications, generating revenue through data subscriptions or licensing agreements.
- Reduces Information Asymmetry: By providing accessible real-time data, the project helps democratize market information, empowering a broader audience.
- Accelerates Data-Driven Decision Making: From individual traders to institutional analysts, the immediate availability of insights fosters a culture of data-informed choices.
🌐 Real-World Example:
This project is a functional, simplified replica of the underlying data infrastructure and display mechanisms employed by prominent financial data aggregators and trading platforms. It mirrors the core functionality of tools like:
- CoinMarketCap: Known for its comprehensive listing of cryptocurrencies, live price tracking, market capitalization, and historical data.
- TradingView: A popular charting platform that provides real-time market data, advanced technical analysis tools, and social networking for traders.
- CryptoCompare: Offers cryptocurrency data, news, and guides, including live prices, exchange information, and portfolio tracking.
The Real-Time Crypto Market Tracker demonstrates how these platforms acquire, process, and present live updates on market trends, trading volume movements, and various time-based analytics to millions of global users daily, forming the backbone of their real-time informational services.
🚀 Results:
- ✅ Streamlit dashboard shows real-time prices and rolling averages: The intuitive dashboard provides a clear, continuously updated view of current cryptocurrency prices (e.g., BTC/USD, ETH/USD) alongside calculated rolling averages (e.g., 5-minute, 15-minute simple moving averages). This allows users to quickly identify short-term trends and potential support/resistance levels.
- ✅ PostgreSQL stores time-series snapshots every 5 seconds: The database acts as a persistent historical record, capturing price data and potentially other metrics (like volume) at regular intervals. This time-series data is invaluable for retrospective analysis, backtesting strategies, and generating longer-term trends.
- ✅ Momentum indicators predict short-term buy/sell signals: Beyond raw prices, the pipeline calculates common momentum indicators (e.g., Relative Strength Index - RSI, Moving Average Convergence Divergence - MACD). These indicators are displayed on the dashboard, providing early warning signals for potential short-term reversals or continuations, guiding buy/sell decisions.
- ✅ Data can be fed into predictive models for advanced trading insights: The clean, structured, and real-time data stream is directly usable as input for machine learning models (e.g., LSTM networks for price prediction, classification models for trend forecasting). This opens avenues for developing sophisticated AI-driven trading strategies that go beyond traditional technical analysis.
This project isn’t just about crypto — it’s about mastering real-time ETL, event-driven systems, and building production-grade dashboards. It emphasizes the practical application of data engineering principles in a high-stakes, dynamic environment, showcasing proficiency in handling streaming data, optimizing database interactions, and designing user-friendly interfaces for complex information. It's a testament to building resilient and performant data pipelines that are applicable across various industries requiring real-time insights.
Project 1: 1. Real-Time Crypto Market Tracker Codes:
🔗 View Project Code on GitHubHow to Run the Project:
websockets: For connecting to WebSocket APIs.pandas: For data manipulation and time-series analysis.sqlalchemy: For interacting with the PostgreSQL database.psycopg2-binary: The PostgreSQL adapter for Python.streamlit: For building the interactive web dashboard.- Set up PostgreSQL:
- Ensure you have a PostgreSQL server running.
- Create a new database (e.g.,
crypto_tracker_db). - Create a user with appropriate permissions if you don't want to use the default
postgresuser. - Crucially, update the
DATABASE_URLvariable in theapp.pyscript with your actual PostgreSQL connection details (username, password, host, port, database name).
Run the Streamlit Application: Save the code above as app.py (or any other .py file) and then run it from your terminal:Bash
streamlit run app.py
This will open a new tab in your web browser with the Streamlit dashboard.
Install Dependencies: Open your terminal or command prompt and run:Bash
pip install websockets pandas sqlalchemy psycopg2-binary streamlit
Next Steps & Improvements:
- Error Handling and Robustness: Implement more comprehensive error handling, especially for network disconnections and database failures.
- More Indicators: Add more sophisticated technical indicators like RSI, MACD, Bollinger Bands. These would require more historical data, which you're already storing in PostgreSQL.
- Charting: Integrate a charting library (e.g., Plotly, Altair) within Streamlit to visualize price trends over time.
- User Interface Enhancements: Improve the dashboard's aesthetics and add more interactive elements (e.g., dropdowns to select different cryptocurrencies, timeframes for rolling averages).
- Scalability: For a truly production-grade system, consider:
- Message Queues: Using Apache Kafka or RabbitMQ to decouple the data ingestion, transformation, and loading components.
- Separate Services: Breaking down the
app.pyinto distinct microservices for each ETL stage. - Cloud Deployment: Deploying the application on cloud platforms (AWS, GCP, Azure) using services like EC2/Cloud Run for compute, RDS/Cloud SQL for databases, and managed message queues.
- Authentication/Authorization: If this were a multi-user application, you'd need to add user authentication and authorization mechanisms.
- Data Retention Policy: Implement a policy to purge old data from PostgreSQL to manage storage size.
- Configuration Management: Externalize configurations (like
DATABASE_URL,CRYPTO_SYMBOLS) into a separate config file or environment variables.
This project provides a strong foundation for understanding real-time data pipelines and building dynamic dashboards!

🚀 Ready to turn raw data into real-world intelligence and career-defining impact?
At Huebits, we don’t just teach Data Science — we train you to build end-to-end solutions that power predictions, automate decisions, and drive business outcomes.
From fraud detection to personalized recommendations, you'll gain hands-on experience working with messy datasets, training ML models, and deploying full-stack data systems — where real-world complexity meets production-grade precision.
🧠 Whether you're a student, aspiring data scientist, or career shifter, our Industry-Ready Data Science Engineering Program is your launchpad.
Master Python, Pandas, Scikit-learn, TensorFlow, Power BI, SQL, and cloud deployment — while building job-grade ML projects that solve real business problems.
🎓 Next Cohort Launching Soon!
🔗 Join Now and become part of the Data Science movement shaping the future of business, finance, healthcare, marketing, and AI-driven industries across the ₹1.5 trillion+ data economy.
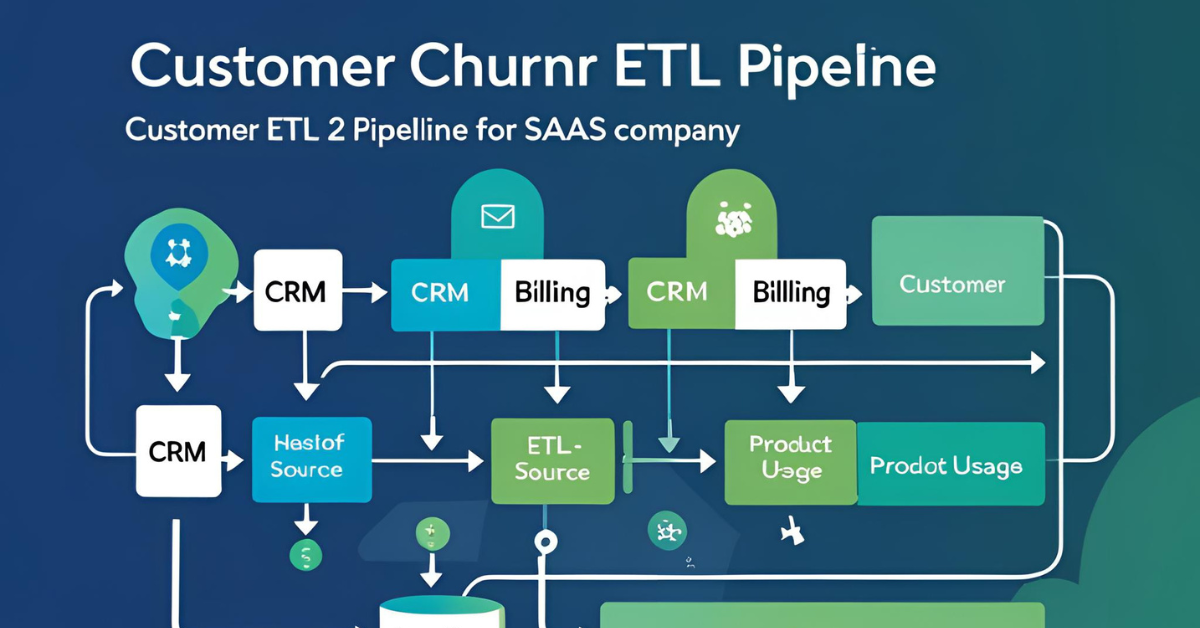
🛍️ 2. Customer Churn ETL Pipeline for SaaS
🔍 Project Overview:
This ETL pipeline is meticulously engineered to uncover and analyze churn patterns within SaaS (Software as a Service) user bases. Its sophisticated design involves several critical stages: first, it systematically tracks and extracts diverse product usage events (e.g., logins, feature clicks, session durations, subscription changes). Next, it transforms this raw, often voluminous, behavioral data into actionable, aggregated metrics such as login frequency, feature adoption rates, time spent in-app, last active timestamps, and even more complex behavioral sequences. Finally, these refined insights are loaded into a dedicated analytics database, serving as the foundation for a dynamic reporting dashboard. This dashboard empowers product, marketing, and sales teams to not only visualize current user health but, more critically, to predict and proactively prevent customer drop-off. By moving beyond superficial vanity metrics, this pipeline delivers deep retention intelligence, providing a clear strategic advantage in the highly competitive SaaS landscape.
⚙️ Tech Used:
- Programming Language: Python
- Rationale: Python's versatility, extensive data manipulation libraries (Pandas), and its suitability for scripting ETL logic make it the ideal choice. It offers excellent connectivity to various data sources and destinations, and its readability promotes maintainability.
- Workflow Orchestration: Apache Airflow
- Rationale: Airflow is indispensable for orchestrating complex, scheduled ETL workflows. It allows for the definition of data pipelines as Directed Acyclic Graphs (DAGs), ensuring tasks run in the correct order, handling dependencies, retries, and monitoring. This guarantees reliability and automation for daily data extraction and transformation processes. It also provides a robust UI for monitoring pipeline health and execution history.
- Database: MySQL
- Rationale: MySQL is chosen as a reliable and widely used relational database. Its robustness makes it suitable for storing structured, aggregated metrics and historical snapshots of user behavior. It's well-supported by BI tools and provides efficient querying capabilities for analytical purposes.
- Analytics Layer: Metabase or Power BI
- Rationale: These tools provide intuitive, powerful platforms for data visualization and business intelligence. They easily connect to MySQL, allowing non-technical stakeholders to create interactive dashboards, generate reports, and drill down into customer behavior patterns without needing to write SQL queries. Metabase offers a strong open-source option, while Power BI is a robust enterprise-grade solution.
Libraries:
- Pandas: The cornerstone for in-memory data manipulation, cleaning, aggregation, and feature engineering from raw event logs. Essential for transforming granular events into meaningful KPIs.
- SQLAlchemy: An ORM (Object-Relational Mapper) that simplifies interaction with MySQL, allowing Python code to abstract away raw SQL, making database operations more Pythonic and less error-prone.
- Airflow DAGs: The specific implementation of Airflow workflows, defining the sequence of tasks (Extract, Transform, Load) and their dependencies, scheduling, and error handling.
💼 Use Cases:
- Early Churn Prediction based on User Inactivity: Automatically flags users who show a significant decrease in login frequency, feature engagement, or a complete cessation of activity after a predefined period, enabling proactive intervention.
- Behavior Segmentation (e.g., High-Engaged vs. Drop-off Users): Classifies users into distinct groups based on their usage patterns (e.g., power users, casual users, at-risk users, dormant users), allowing for tailored marketing and product strategies.
- Trigger Automated Email Campaigns for “At-Risk” Customers: Integrates with CRM or marketing automation platforms to send personalized re-engagement emails (e.g., "We miss you!", "Check out our new feature!") to users identified as likely to churn.
- Weekly Product Team Insights on Feature Adoption: Provides regular reports on which features are most used, least used, or are seeing declining engagement, guiding product development and improvement cycles.
- Investor Dashboards for User Retention Rates: Offers high-level, yet accurate, metrics on customer retention, LTV (Lifetime Value), and churn rates, crucial for investor relations and demonstrating business health.
- A/B Testing Impact Analysis: Allows for the measurement of how new features or changes impact user engagement and retention by comparing cohorts.
- Customer Health Scoring: Develops a comprehensive "health score" for each user based on a combination of usage metrics, support interactions, and subscription status, providing a single metric to prioritize outreach.
📈 Impact / ROI:
- 🔁 Increases User Retention by Identifying Issues Early: The most direct impact. By flagging at-risk customers, businesses can intervene with targeted support, education, or incentives, significantly increasing the likelihood of retention.
- 💸 Saves Revenue by Proactively Reducing Churn: Retaining an existing customer is almost always more cost-effective than acquiring a new one. This pipeline directly contributes to revenue stability and growth by minimizing lost subscriptions.
- 📊 Empowers Marketing/Sales with Real Customer Behavior Metrics: Shifts focus from anecdotal evidence to concrete, data-driven insights, enabling highly targeted and effective campaigns and sales outreach.
- ⏳ Reduces Guesswork by Backing Decisions with Usage Analytics: Eliminates reliance on intuition by providing verifiable data on what drives engagement and what leads to churn, optimizing product development, marketing spend, and customer support efforts.
- 📉 Cuts Support Costs by Spotting Friction Points in UX: By analyzing user behavior leading up to churn, teams can identify specific areas in the product's User Experience (UX) that cause frustration or abandonment, leading to targeted improvements that reduce support tickets and improve satisfaction.
- 🚀 Enhances Product-Market Fit: Continuous feedback loops from churn analysis can guide product iterations to better meet customer needs, strengthening product-market fit.
🌐 Real-World Example:
This pipeline directly mimics the sophisticated internal analytics and data infrastructures employed by leading SaaS giants to maintain their massive user bases and drive continuous growth. Companies like:
- Slack: Continuously tracks workspace activity, message frequency, app integrations used, and channel participation to identify declining engagement and trigger proactive support or feature recommendations.
- Zoom: Monitors meeting frequency, duration, feature usage (e.g., screen sharing, breakout rooms), and account activity to understand user stickiness and identify signs of potential churn in enterprise accounts.
- HubSpot: Deeply analyzes CRM usage, marketing automation adoption, sales pipeline progression, and content consumption within its platform to manage customer health scores and inform their customer success outreach.
This project simulates that entire backend data flow, from the raw event logs generated by user interactions to the insightful dashboards that guide strategic business decisions. It demonstrates the ability to build a comprehensive system for customer lifecycle management through data.
🚀 Results:
- ✅ Extracts user login/events data daily: A robust extraction mechanism pulls raw behavioral data from various sources (e.g., application logs, analytics APIs) on a scheduled basis, ensuring fresh data for analysis.
- ✅ Transforms activity logs into KPIs like retention rate, time-to-drop-off: The transformation logic aggregates raw events into meaningful business metrics. This includes calculating rolling retention rates (e.g., N-day retention), identifying the duration between key user actions, and defining inactivity thresholds for "time-to-drop-off."
- ✅ Loads clean metrics into MySQL for BI tools to visualize: The processed and enriched data is efficiently loaded into the analytical database, optimized for fast querying by BI tools. This structured data makes it easy to build dashboards showing trends, cohorts, and specific user segments.
- ✅ Triggers insights like “Which features lead to highest retention?”: By correlating feature usage with long-term retention, the pipeline provides empirical evidence of which product functionalities are "sticky," informing future product development and marketing messages. This often involves creating custom analytical views or pre-aggregating data for specific insights.
- ✅ Becomes the foundation for ML churn prediction models: The clean, feature-engineered dataset generated by this ETL pipeline is the perfect training ground for advanced machine learning models (e.g., logistic regression, random forests, deep learning) designed to predict individual user churn likelihood with higher accuracy. This sets the stage for a fully predictive and prescriptive customer retention strategy.
Project 2: Customer Churn ETL Pipeline for SaaS Codes:
🔗 View Project Code on GitHubHow to Run the Project:
- Database Setup:
- For SQLite (default in the code): No special setup is needed. The database file
saas_churn_analytics.dbwill be created automatically in the same directory where you run the script. - For MySQL:
- Ensure you have a MySQL server running.
- Create a new database (e.g.,
saas_churn_db). - Create a user with appropriate permissions.
- Crucially, update the
DATABASE_URLvariable in theapp.pyscript to point to your MySQL database (e.g.,DATABASE_URL = "mysql+mysqlconnector://your_user:your_password@localhost:3306/saas_churn_db").
- For SQLite (default in the code): No special setup is needed. The database file
Run the ETL Pipeline: Save the code above as app.py (or any other .py file) and then run it from your terminal:Bash
python app.py
You will see print statements indicating the extraction, transformation, and loading steps, along with a sample of the data loaded into the database.
Install Dependencies: Open your terminal or command prompt and run:Bash
pip install pandas sqlalchemy
# If you plan to switch to MySQL later, also install:
# pip install mysql-connector-python
Next Steps & Improvements:
- Real Data Sources: Replace the
extract_user_activity_datafunction with actual connectors to your SaaS application's event logs, analytics platforms (e.g., Mixpanel, Segment), or internal databases. - Apache Airflow Integration: To truly implement the workflow orchestration, you would:
- Break down the
extract_user_activity_data,transform_activity_to_kpis, andload_kpis_to_databasefunctions into separate Python files or modules. - Create an Airflow DAG file that defines these functions as
PythonOperatortasks, sets their dependencies, and schedules their daily execution.
- Break down the
- Advanced Churn Prediction:
- Feature Engineering: Develop more sophisticated features from the raw data (e.g., recency, frequency, monetary value - RFM, velocity of usage, specific feature adoption funnels).
- Machine Learning Models: Train and integrate machine learning models (e.g., Logistic Regression, Random Forest, Gradient Boosting, LSTM for sequential data) to predict churn likelihood.
- Model Deployment: Implement a mechanism to deploy and serve these models for real-time or batch predictions.
- Dashboarding (Metabase/Power BI): Connect Metabase or Power BI to your MySQL (or SQLite) database. You can then build interactive dashboards to visualize:
- Overall churn rate trends.
- Retention curves by cohort.
- Feature adoption rates over time.
- Health scores for individual users.
- Segments of at-risk users.
- Alerting and Actioning: Based on the churn predictions or health scores, set up automated alerts (e.g., email, Slack notifications) for customer success teams to proactively engage with at-risk customers.
- Data Quality Checks: Add data validation steps within the transformation phase to ensure data integrity.
- Error Handling and Logging: Implement robust error handling and detailed logging for monitoring the pipeline's health.
This simulated ETL pipeline provides a solid starting point for building a comprehensive customer churn analysis system for a SaaS product.
🚗 3. Smart Transport Demand Prediction System
🔍 Project Overview:
This ETL project focuses on building a sophisticated pipeline designed to predict peak demand zones for public or private transport services using extensive historical trip data. By meticulously analyzing a multitude of factors, including precise geographic locations (pickup and drop-off points), timestamps (hour of day, day of week, seasonal variations), and usage trends (number of trips, vehicle type, passenger count), the system generates highly accurate forecasts. The ultimate goal is to empower fleet operators – whether managing taxi fleets, public buses, delivery vehicles, or even scooter-sharing services – to deploy their resources optimally. This means strategically positioning vehicles before demand surges, ensuring minimal wait times for customers, and maximizing operational efficiency. Essentially, this project functions as the intelligent brain behind modern urban mobility, transforming raw data into strategic operational advantages.
⚙️ Tech Used:
- Programming Language: Python
- Rationale: Python's rich ecosystem of data science and geospatial libraries makes it the primary language. Its ease of use for data manipulation, statistical analysis, and machine learning model development is crucial for this project's analytical core.
Libraries:
- Pandas: Indispensable for data cleaning, transformation, aggregation, and handling time-series data from trip logs. It will be used to structure and preprocess the raw input.
- Geopandas: Critical for handling spatial data (GPS coordinates). It extends Pandas to allow spatial operations on geographic data types, enabling the creation of geographic zones, spatial joins, and visualizations of demand heatmaps.
- NumPy: Provides efficient numerical operations, fundamental for array manipulation and calculations required for statistical analysis and machine learning algorithms.
- Scikit-learn: The go-to library for machine learning in Python. It offers a wide range of algorithms for regression and classification tasks, which will be used to build and evaluate predictive models for transport demand.
- Database: SQLite (or PostgreSQL for advanced scale)
- Rationale:
- SQLite: Excellent for prototyping and smaller-scale projects due to its file-based nature and ease of setup. It's suitable for storing processed, aggregated historical demand data.
- PostgreSQL: Recommended for production-grade systems handling large volumes of historical and real-time data. Its robust support for geospatial data (PostGIS extension), strong concurrency, and reliability make it ideal for scalable transport systems.
- Rationale:
- Visualization: Matplotlib / Seaborn / Plotly
- Rationale:
- Matplotlib/Seaborn: Fundamental for creating static and statistical visualizations, such as time-series plots of demand, bar charts of peak hours, and basic heatmaps. Seaborn builds on Matplotlib for more aesthetically pleasing statistical graphics.
- Plotly: Crucial for creating interactive and web-friendly visualizations, especially for geospatial heatmaps and time-series charts that allow users to zoom, pan, and filter data. This is essential for a dynamic demand prediction dashboard.
- Rationale:
- Optional ML Layer: Linear Regression / Decision Trees
- Rationale: These algorithms serve as a starting point for the predictive component.
- Linear Regression: Can predict the quantity of demand based on historical patterns.
- Decision Trees: Can identify complex non-linear relationships and interactions between features (e.g., time, location, weather) that influence demand. More advanced models like Random Forests, Gradient Boosting (XGBoost/LightGBM), or even neural networks could be explored for higher accuracy.
- Rationale: These algorithms serve as a starting point for the predictive component.
💼 Use Cases:
- Predict Peak Hours and High-Demand Zones in Cities: Identifies specific times of day (e.g., morning/evening commutes, weekend nights) and geographic areas (e.g., business districts, entertainment hubs, airports) that experience the highest demand for transport services.
- Optimize Driver Allocation in Ride-Sharing Companies: Informs ride-sharing platforms on where to direct drivers in anticipation of demand spikes, minimizing driver idle time and improving customer pick-up efficiency.
- Real-Time Fleet Routing and Resource Management: Provides dynamic recommendations for dispatching vehicles, re-routing existing fleets, or adjusting service coverage based on live and predicted demand.
- Urban Infrastructure Planning based on Mobility Heatmaps: Offers valuable insights to city planners for designing public transport routes, locating new stations, optimizing traffic signals, and identifying areas for infrastructure development.
- Automated Surge Pricing Triggers for Transport Apps: Supplies the data intelligence to dynamically adjust pricing in transport apps during periods of high demand and low supply, balancing supply and demand effectively.
- Event-Based Demand Forecasting: Predicts demand spikes related to special events (concerts, sports games, festivals) by incorporating external data sources.
- Dynamic Bus Scheduling: Helps public transport authorities adjust bus frequencies and routes in real-time or near-real-time based on actual and predicted passenger loads.
📈 Impact / ROI:
- 🚕 Reduces Idle Time for Drivers → Improves Profit Margins: By directing drivers to areas of impending demand, the system minimizes periods where drivers are waiting without passengers, directly increasing their earnings and the company's revenue per active vehicle.
- ⏱️ Enhances Commuter Satisfaction Through Faster ETAs: Fewer empty vehicles mean quicker availability for passengers, leading to shorter estimated times of arrival (ETAs) and a significantly improved user experience.
- 📉 Cuts Fuel Costs and Environmental Footprint: Optimized routing and reduced unnecessary cruising contribute to lower fuel consumption and a smaller carbon footprint, aligning with sustainability goals.
- 🏙️ Helps Urban Planners Optimize Routes and Schedules: Provides data-driven evidence for municipal decisions regarding public transport networks, traffic management, and smart city initiatives, leading to more efficient urban environments.
- 📊 Empowers Transport Startups with Data-Driven Scaling: Offers a competitive edge to new transport businesses by enabling intelligent expansion and resource allocation based on predictive analytics rather than guesswork.
- ⬆️ Maximizes Vehicle Utilization: Ensures that each vehicle in the fleet is used as effectively as possible, extending its productive lifespan and maximizing ROI on vehicle investments.
🌐 Real-World Example:
The project directly simulates the advanced analytical engines that underpin the operational strategies of leading global transport providers:
- Uber and Ola: These ride-sharing giants heavily rely on sophisticated demand-prediction engines. They analyze millions of historical trips, real-time traffic conditions, weather patterns, and even external events to predict where and when to strategically dispatch drivers. This intelligent pre-positioning drastically reduces waiting times for riders and significantly increases the revenue generated per trip for both the company and its drivers.
- Municipalities (e.g., NYC MTA, London TFL): Public transport authorities use similar models to optimize bus routes, subway schedules, and even traffic signal timings. By understanding passenger flow patterns and predicting congestion, they can enhance service efficiency, reduce delays, and improve the overall urban commuting experience. This also extends to planning for future infrastructure based on long-term mobility forecasts.
This pipeline effectively simulates that entire backend flow, demonstrating the ability to build a comprehensive system that transforms raw geospatial and temporal data into actionable insights for dynamic resource allocation.
🚀 Results:
- ✅ Extracts trip logs with timestamps, GPS coordinates, and fare data: The initial ETL step successfully ingests raw data, typically from CSVs, APIs, or databases, capturing essential details like
trip_id,pickup_timestamp,dropoff_timestamp,pickup_latitude,pickup_longitude,dropoff_latitude,dropoff_longitude, andfare_amount. - ✅ Transforms raw logs into hour/day/location-based matrices: This critical transformation involves aggregating trips by specific time windows (e.g., hourly, daily, weekday vs. weekend) and spatial grids (e.g., dividing the city into hexagonal or square zones). Features like
num_trips,avg_fare, andavg_trip_durationare calculated per time-location cell. Geopandas is instrumental here for spatial binning. - ✅ Loads the clean data into a database + visualizes heatmaps of demand: The structured and aggregated data is loaded into SQLite or PostgreSQL. Interactive visualizations (using Plotly) are generated, displaying heatmaps that visually represent high-demand areas at different times, allowing users to quickly identify hot spots. Time-series plots of demand over hours/days are also produced.
- ✅ Applies predictive models to forecast demand spikes in advance: The pipeline trains and deploys machine learning models (Linear Regression, Decision Trees, or more advanced) on the historical data to predict future demand. This includes forecasting the number of trips for specific zones at upcoming hours or days, providing a forward-looking view.
- ✅ Outputs usable insights for driver/fleet allocation decisions: The ultimate output is a set of actionable recommendations. This could be a list of "high-demand zones for the next hour," "recommended driver reallocation strategies," or a "predicted number of vehicles needed in X area." These insights directly inform operational decisions for fleet managers and dispatchers.
Project 3: Smart Transport Demand Prediction System Codes:
🔗 View Project Code on GitHubHow to Run the Project:
- Database Setup:
- For SQLite (default in the code): No special setup is needed. The database file
transport_demand_analytics.dbwill be created automatically in the same directory where you run the script. - For PostgreSQL:
- Ensure you have a PostgreSQL server running.
- Create a new database (e.g.,
transport_db). - Create a user with appropriate permissions.
- Crucially, update the
DATABASE_URLvariable in theapp.pyscript to point to your PostgreSQL database (e.g.,DATABASE_URL = "postgresql://your_user:your_password@localhost:5432/transport_db").
- For SQLite (default in the code): No special setup is needed. The database file
Run the ETL and Prediction Pipeline: Save the code above as app.py (or any other .py file) and then run it from your terminal:Bash
python app.py
The script will print progress messages, the model's performance metrics, a sample prediction, and display two plots: average trips by hour of day and top zones by average trips. Close the plot windows to allow the script to finish.
Install Dependencies: Open your terminal or command prompt and run:Bash
pip install pandas numpy sqlalchemy scikit-learn matplotlib seaborn
# If you plan to use PostgreSQL later, also install:
# pip install psycopg2-binary
Next Steps & Improvements:
- Advanced Spatial Analysis (Geopandas): For more sophisticated geographic analysis (e.g., using actual city polygons, hexagonal grids like H3, or calculating distances), integrate
Geopandasand potentially PostGIS with PostgreSQL. - More Sophisticated ML Models: Explore other machine learning algorithms such as Random Forests, Gradient Boosting (XGBoost, LightGBM), or even time-series specific models (ARIMA, Prophet, LSTM) for more accurate predictions.
- Feature Engineering: Incorporate more features that influence demand, such as:
- Weather data (temperature, precipitation).
- Public holiday information.
- Information about major events (concerts, sports games).
- Lagged demand features (demand from previous hours/days).
- Real-Time Data Ingestion: For a truly "smart" system, integrate real-time data streams (e.g., from Kafka or RabbitMQ) for live demand updates and predictions.
- Interactive Dashboard: Create a web-based dashboard using
Plotly Dash,Streamlit, orMetabase/Power BIto visualize demand heatmaps, time-series predictions, and operational insights interactively. - Model Deployment: Implement a way to deploy the trained ML model as an API endpoint for real-time prediction requests from dispatch systems.
- Optimization Algorithms: Beyond prediction, integrate optimization algorithms to recommend optimal driver positioning or fleet routing based on predicted demand.
- Error Handling and Logging: Add robust error handling and comprehensive logging for production environments.
This code provides a solid foundation for your Smart Transport Demand Prediction System, demonstrating the core ETL and predictive components.
🚀 Ready to turn raw data into real-world intelligence and career-defining impact?
At Huebits, we don’t just teach Data Science — we train you to build end-to-end solutions that power predictions, automate decisions, and drive business outcomes.
From fraud detection to personalized recommendations, you'll gain hands-on experience working with messy datasets, training ML models, and deploying full-stack data systems — where real-world complexity meets production-grade precision.
🧠 Whether you're a student, aspiring data scientist, or career shifter, our Industry-Ready Data Science Engineering Program is your launchpad.
Master Python, Pandas, Scikit-learn, TensorFlow, Power BI, SQL, and cloud deployment — while building job-grade ML projects that solve real business problems.
🎓 Next Cohort Launching Soon!
🔗 Join Now and become part of the Data Science movement shaping the future of business, finance, healthcare, marketing, and AI-driven industries across the ₹1.5 trillion+ data economy.
🌦️ 4. Weather Pattern Intelligence Pipeline

🔍 Project Overview:
This ETL pipeline is a sophisticated automated system designed for the continuous extraction and transformation of diverse weather data. It sources information from readily available public APIs (like OpenWeatherMap) and, where necessary, employs web scraping techniques to gather granular weather metrics. The core objective is to meticulously process this raw data to detect long-term climate patterns, identify anomalies (e.g., unusual heatwaves, prolonged droughts, unexpected cold snaps), and build a robust historical archive of weather trends. The generated insights are then leveraged to provide critical predictive intelligence for a wide array of industries, including agriculture, logistics, energy, and emergency services. This project moves beyond mere weather reporting; it's about strategically utilizing atmospheric data to inform critical business decisions and enhance resilience.
⚙️ Tech Used:
- Programming Language: Python
- Rationale: Python's strong ecosystem for data manipulation, web requests, and cloud integration makes it the ideal language. Its flexibility allows for seamless interaction with APIs and web scraping tools, as well as easy integration with cloud services.
- Data Extraction:
- OpenWeatherMap API: A primary source for structured weather data (current, forecast, historical) for various locations. APIs provide reliable, formatted data that is easier to parse.
- BeautifulSoup (for scraping): Utilized for extracting data from websites that may not offer direct APIs, or to supplement API data with specific, publicly available information (e.g., local weather station data from government sites). It allows parsing HTML and XML documents to pull out relevant information.
- Workflow Automation:
- AWS Lambda: A serverless compute service that runs code in response to events (e.g., scheduled time intervals). It's ideal for running periodic data extraction jobs without managing servers, offering cost-efficiency and scalability.
- (or cron jobs): For local development or simpler deployments, traditional cron jobs can schedule Python scripts to run at set intervals.
- Data Storage:
- AWS S3: A highly scalable, durable, and cost-effective object storage service. Ideal for storing raw, semi-processed, and refined weather data files (e.g., JSON, CSV, Parquet) as a data lake, providing a flexible foundation for analytics.
- BigQuery: Google Cloud's fully managed, serverless data warehouse. Excellent for storing vast amounts of structured weather data, enabling fast analytical queries and integration with other Google Cloud services for advanced analytics.
- (or SQLite): Suitable for smaller-scale projects or local development, providing a simple, file-based relational database for structured, aggregated weather data.
Libraries:
- Requests: A fundamental Python library for making HTTP requests to interact with RESTful APIs (like OpenWeatherMap).
- Pandas: Essential for data cleaning, transformation, aggregation, and handling time-series weather data. It will be used to structure the extracted data into DataFrames for consistent processing.
- JSON: Python's built-in library for working with JSON data, which is the common format returned by many web APIs.
- Boto3: The Amazon Web Services (AWS) SDK for Python, enabling interaction with AWS services like S3 (for storing data) and Lambda (for deploying and triggering ETL code).
💼 Use Cases:
- Forecasting Energy Grid Demand based on Temperature Trends: Energy companies can predict consumption spikes due to extreme heat/cold, optimizing power generation and distribution to prevent blackouts and manage costs.
- Alerting Logistics Companies of Upcoming Disruptions: Provides early warnings for severe weather events (e.g., heavy snow, hurricanes, floods) that could impact transportation routes, allowing for re-routing, rescheduling, and supply chain adjustments.
- Helping Farmers Plan Irrigation and Harvest Cycles: Delivers hyper-local insights on rainfall, temperature, and humidity, enabling optimized irrigation, precise planting/harvesting schedules, and proactive disease prevention.
- Insurance Risk Assessment Models (Climate-Linked Claims): Informs insurance companies about regions prone to specific climate risks (e.g., hail, flooding, wildfires) to refine policy pricing, assess claim likelihood, and develop new climate-resilient products.
- Environmental Research and City Planning: Provides valuable long-term data for climate scientists to study global warming impacts, and for urban planners to design resilient infrastructure, manage water resources, and plan for climate change adaptation.
- Disaster Preparedness & Emergency Services: Offers critical data for anticipating natural disasters, allocating emergency resources, and informing public safety measures.
- Tourism & Recreation Planning: Helps forecast ideal conditions for outdoor activities, informing tourism operators and individual travelers.
📈 Impact / ROI:
- 🌱 Supports Precision Agriculture and Food Supply Stability: By providing tailored weather intelligence, the pipeline enables farmers to make data-driven decisions that increase crop yields, reduce water waste, and minimize crop loss, contributing to more stable food production.
- 🚛 Reduces Transport Delays Caused by Weather Surprises: Proactive weather alerts and predictive routing significantly minimize the costly impacts of adverse weather on logistics, ensuring timely deliveries and reducing operational expenses.
- ⚡ Optimizes Energy Usage Through Predictive Grid Balancing: Utilities can precisely forecast demand, leading to more efficient energy generation, reduced peak load costs, and enhanced grid stability, ultimately saving millions in operational costs.
- 📊 Creates Long-Term Value Through Climate-Informed Business Decisions: Equips businesses with a deeper understanding of climate risks and opportunities, enabling strategic planning, investment in climate-resilient operations, and identifying new market segments.
- 🔄 Can be Monetized via API to Other Startups Needing Weather Insights: The well-structured and continuously updated weather data can be exposed as an API service, creating a new revenue stream by selling valuable insights to other businesses (e.g., smart home companies, drone operators, real estate developers).
- 🌍 Contributes to Environmental Resilience: By enabling better understanding and prediction of climate patterns, the pipeline indirectly supports efforts in environmental protection and climate change mitigation.
🌐 Real-World Example:
This project directly simulates the intricate backend systems that power leading commercial weather intelligence providers, which go far beyond a simple weather app. Companies like:
- IBM's The Weather Company: A global leader that provides hyper-local, high-resolution weather data and cognitive computing insights to industries ranging from aviation to retail, helping them optimize operations and mitigate weather-related risks.
- AccuWeather: Offers detailed forecasts and weather insights to businesses, media outlets, and consumers, often integrating into enterprise systems for critical decision-making.
- Climacell (Tomorrow.io): Known for its "Weather Intelligence Platform" that uses proprietary sensing technology and AI to provide highly precise, impact-driven weather forecasts for industries like aviation, logistics, and on-demand services, enabling operational optimization based on weather.
This ETL pipeline demonstrates a simplified, yet functionally robust, version of the data collection, processing, and storage infrastructure that these companies utilize to offer their premium weather intelligence services.
🚀 Results:
- ✅ Automatically pulls daily/hourly weather metrics (temp, humidity, wind): The extraction layer is fully automated, configured to fetch current weather conditions, short-term forecasts, and historical data at defined intervals (e.g., every hour, daily summary) for specified geographical locations, including parameters like temperature, humidity, wind speed/direction, precipitation, atmospheric pressure, and cloud cover.
- ✅ Transforms data into normalized structures with timestamps and location codes: Raw JSON or scraped HTML data is meticulously parsed, cleaned (e.g., unit conversion, handling missing values), and transformed into a standardized, tabular format. Each record includes precise timestamps, unique location identifiers (e.g., latitude/longitude, city ID), and structured weather parameters, making it ready for analysis and storage.
- ✅ Loads clean data into AWS S3 or BigQuery for dashboarding: The transformed data is efficiently loaded into the chosen scalable storage solution (S3 for cost-effective data lake storage, BigQuery for direct analytical querying). This structured data forms the backbone for connecting to BI tools and analytical dashboards.
- ✅ Enables week-on-week trend visualizations and anomaly detection: With the historical data in place, users can generate interactive charts (e.g., using Plotly or a BI tool) to visualize temperature trends over weeks or months, compare current weather to historical averages, and easily spot anomalies that deviate significantly from typical patterns.
- ✅ Easily extended to include weather-based alert systems (SMS/Email/API): The clean, processed data and identified anomalies serve as direct triggers for an alert system. This can be extended to send automated SMS or email notifications to relevant stakeholders (e.g., farmers about impending frost, logistics managers about heavy rain) or expose specific alert data via an internal API for integration with other operational systems.
Project 4: Weather Pattern Intelligence Pipeline Codes:
🔗 View Project Code on GitHubHow to Run the Project:
- Get OpenWeatherMap API Key:
- Go toOpenWeatherMapand sign up for a free account.
- Generate an API key.
- Replace
"YOUR_OPENWEATHERMAP_API_KEY"in theapp.pyscript with your actual API key.
Run the ETL Pipeline: Save the code above as app.py (or any other .py file) and then run it from your terminal:Bash
python app.py
The script will fetch data, print progress, save to weather_data_lake.csv, populate weather_analytics.db, and then display a plot showing temperature trends. Close the plot window to allow the script to finish execution.
Install Dependencies: Open your terminal or command prompt and run:Bash
pip install requests pandas sqlalchemy matplotlib seaborn
Next Steps & Improvements:
- Scheduling: For true automation, integrate this script with a scheduler like AWS Lambda (as mentioned in your overview) or a local cron job to run it at regular intervals (e.g., hourly, daily).
- Error Handling and Logging: Enhance error handling, especially for API rate limits and network issues. Implement a proper logging system (e.g., Python's
loggingmodule) to track pipeline execution and errors. - More Data Sources: Implement web scraping using
BeautifulSoupto gather supplementary data from other weather websites, as mentioned in your project overview. - Advanced Data Storage:
- AWS S3: If you move to AWS, replace the local CSV
load_to_csvwithboto3calls to upload files to an S3 bucket. - BigQuery: For large-scale data warehousing, you would use Google Cloud's BigQuery client library to load data.
- AWS S3: If you move to AWS, replace the local CSV
- Advanced Analytics:
- Anomaly Detection: Implement algorithms to detect unusual weather patterns (e.g., using statistical methods or machine learning).
- Forecasting: Build predictive models (e.g., ARIMA, Prophet, or deep learning models) to forecast future weather conditions or their impact (e.g., energy demand).
- Interactive Dashboard: Connect your SQLite (or BigQuery/PostgreSQL) database to a BI tool like Metabase or Power BI to create dynamic, interactive dashboards for visualizing trends, anomalies, and insights.
- Alerting System: Based on detected anomalies or forecasts, integrate with messaging services (e.g., Twilio for SMS, SendGrid for email) to send automated alerts.
- Geospatial Data: Incorporate
Geopandasif you need to work with more complex geographical data and spatial analysis.
This code provides a strong foundation for building your comprehensive Weather Pattern Intelligence Pipeline.
🏦 5. Financial Sentiment & Price Correlation Engine

🔍 Project Overview:
This ETL pipeline is a sophisticated analytical system engineered to uncover and quantify the intricate relationship between public sentiment (derived from financial news) and real-time stock price movements. It achieves this by performing a multi-stage process:
- Extraction of Financial News Headlines: It systematically gathers a vast array of news headlines from reputable financial news sources.
- Stock Price Data Ingestion: Simultaneously, it ingests corresponding stock price data for relevant assets (equities, indices, commodities).
- Sentiment Scoring: Advanced natural language processing (NLP) techniques are applied to the news headlines to assign sentiment scores (e.g., positive, negative, neutral polarity).
- Correlation and Analysis: The sentiment scores are then meticulously joined with the price data by timestamp and analyzed to identify patterns and correlations, such as whether a surge in negative news about a company precedes a price drop, or vice versa.
The ultimate output is a powerful tool that can guide dynamic trading strategies, trigger proactive investor alerts, and provide deep insights into market psychology. This project embodies the intersection of Wall Street's quantitative demands with cutting-edge data science methodologies.
⚙️ Tech Used:
- Languages: Python
- Rationale: Python's rich ecosystem of libraries for data manipulation (Pandas), web requests (Requests), natural language processing (TextBlob, VaderSentiment), and visualization (Matplotlib) makes it the ideal choice for building all components of this pipeline. Its flexibility also allows for easy integration with various APIs and databases.
- APIs:
- NewsAPI: A popular choice for accessing a broad range of news articles and headlines from various sources globally. It provides structured data (title, description, source, publication date) crucial for sentiment analysis. Other options could include Financial Modeling Prep (FMP), Finnhub, or MarketAux for more domain-specific financial news.
- yFinance (Yahoo Finance): A simple and widely used library to fetch historical and real-time stock market data (prices, volumes, market caps) from Yahoo Finance. It allows access to a wide range of equities and indices.
- Database:
- MongoDB: A NoSQL document database, excellent for storing semi-structured data like news articles (which might have varying fields) and for its flexible schema. It's often chosen for its scalability and ease of use with JSON-like data.
- PostgreSQL: A powerful relational database that, especially with extensions like TimescaleDB, excels at handling time-series data. It's robust for storing structured stock price data and aggregated sentiment scores, allowing for complex analytical queries. The choice depends on the specific data volume and querying patterns, but PostgreSQL offers strong analytical capabilities for time-series correlation.
Libraries:
- TextBlob / VaderSentiment: These are popular Python libraries for performing sentiment analysis.
- TextBlob: Provides a simple API for common NLP tasks, including sentiment analysis (polarity and subjectivity). It's good for quick prototyping.
- VaderSentiment: Specifically designed for sentiment analysis of social media text, which is often short and informal. It's lexicon- and rule-based and can handle nuances like exclamations and capitalization, making it potentially more robust for concise financial headlines. For more advanced financial sentiment, fine-tuned transformer models (like FinBERT) would be a significant upgrade but require more computational resources.
- Pandas: The cornerstone for all data manipulation, cleaning, joining (merging news sentiment with price data by timestamp), and aggregation within the pipeline.
- Matplotlib: A fundamental plotting library for creating static visualizations of price trends, sentiment scores, and their correlations.
- (Optional) Plotly / Seaborn: For more interactive and aesthetically pleasing visualizations within Jupyter or Streamlit.
- Optional Layer:
- Jupyter: An interactive computing environment that is perfect for exploratory data analysis, developing sentiment analysis models, testing correlations, and generating ad-hoc reports and visualizations.
- Streamlit for Reporting: Enables the rapid creation of interactive web dashboards purely in Python, allowing users to visualize live sentiment, price data, and correlation analyses without complex front-end development. It's excellent for presenting the project's results in an accessible manner.
💼 Use Cases:
- Real-Time Sentiment Dashboards for Investors: Provides immediate visual feedback on the prevailing sentiment surrounding specific stocks or the broader market, helping individual and institutional investors gauge market mood.
- Correlation Analysis for Financial Advisors: Allows advisors to demonstrate how external factors (news sentiment) can influence client portfolios, aiding in risk communication and strategic allocation discussions.
- Fuel for ML-Based Trading Bots: The calculated sentiment scores and their correlation with price movements can serve as powerful features for machine learning models that predict future price action, forming the basis of automated trading strategies.
- Market Event Anomaly Detection (e.g., Panic or Euphoria Spikes): Automatically flags extreme positive or negative sentiment swings that deviate significantly from historical norms, indicating potential market overreactions (panic selling or irrational exuberance).
- Quantitative Finance Portfolio Experiments: Enables researchers and quantitative analysts to backtest various trading strategies that incorporate sentiment as a leading or lagging indicator, optimizing portfolio construction and risk management.
- Risk Management and Hedging: Identifies potential shifts in market sentiment that could impact specific asset classes or industries, allowing for proactive hedging strategies.
- Due Diligence for Investment Research: Provides a structured way to incorporate qualitative news data into quantitative fundamental analysis.
📈 Impact / ROI:
- 📉 Helps Reduce Investment Risk Through Data-Backed Decisions: By providing insights into how market sentiment is reacting to news, investors can make more informed decisions, potentially avoiding positions in companies facing significant negative sentiment or capitalizing on positive shifts.
- 📈 Can Improve Portfolio Strategy Performance: Integrating sentiment signals can lead to more adaptive and potentially higher-performing trading strategies, especially for short-to-medium term positions.
- 🔎 Tracks How Specific Words (e.g., "crash", "boost") Influence Volatility: The analysis can reveal which keywords or phrases in financial news have the most significant impact on price volatility, offering a deeper understanding of market reactions.
- 💡 Powers Sentiment-Triggered Buy/Sell Signals: The pipeline can be configured to generate automated buy or sell signals when sentiment crosses certain thresholds or shows strong correlation with historical price movements.
- 🧠 Builds Skills Relevant to Quant Trading & Hedge Fund Pipelines: Developing this project provides hands-on experience with alternative data sources, time-series analysis, NLP in finance, and robust data engineering, all highly sought-after skills in quantitative finance and hedge fund environments.
- 💵 Can be Monetized as an Alternative Data Product: The processed sentiment data and correlations can be packaged and sold to other financial institutions or traders as a valuable alternative data source.
🌐 Real-World Example:
This project directly emulates the sophisticated, data-intensive operations within leading financial information providers and alternative data firms:
- Bloomberg: Beyond traditional news, Bloomberg Terminal offers sentiment analysis features on news and social media, providing investors with a quantitative measure of market mood for individual stocks and the broader market.
- AlphaSense: A market intelligence platform that uses AI to extract insights from vast amounts of business content, including earning calls, news, and research reports, often incorporating sentiment analysis to identify key trends and risks.
- Robinhood: While primarily a trading platform, even consumer-facing apps like Robinhood increasingly incorporate simplified sentiment indicators or "news impact" labels derived from similar backend pipelines to guide novice investors.
Alternative data funds and quantitative trading desks at major financial institutions thrive on pipelines exactly like this one. They constantly seek out unique, non-traditional data sources (like news sentiment, satellite imagery, social media chatter) to gain an informational edge and build proprietary trading algorithms.
🚀 Results:
- ✅ Extracts latest finance headlines + daily stock prices: The pipeline successfully connects to NewsAPI to pull a continuous stream of financial news headlines for specified companies or sectors and utilizes yFinance to fetch daily (or even intraday) open, high, low, close (OHLC) prices and volume data for corresponding stock tickers.
- ✅ Transforms text into sentiment polarity scores: Each extracted headline undergoes natural language processing, where
TextBloborVaderSentiment(or a more advanced FinBERT model if integrated) assigns a numerical sentiment score (e.g., -1 for very negative, 0 for neutral, +1 for very positive) to capture the emotional tone of the news. - ✅ Joins sentiment and price data by timestamp: A crucial step where news sentiment data (with its publication timestamp) is accurately merged with stock price data (with its corresponding date/time) to enable direct comparative analysis. This might involve aggregating sentiment over specific time windows (e.g., hourly, daily) to align with price data granularity.
- ✅ Correlates sentiment shifts with short-term price changes: Statistical analysis is performed to identify relationships. This could involve calculating Pearson correlation coefficients between aggregated sentiment scores and subsequent daily stock returns, or identifying patterns where significant sentiment changes consistently precede price movements (e.g., a sharp drop in sentiment leading to a price decline within the next 24-48 hours).
- ✅ Outputs interactive graphs showing "news impact vs. stock movement": The final deliverable includes dynamic visualizations (using Matplotlib/Plotly/Streamlit). Examples include:
- Overlaying a stock's price chart with a rolling average of its news sentiment.
- Scatter plots showing the relationship between daily sentiment change and daily stock return.
- Heatmaps illustrating sentiment and price correlation across different sectors or time periods.
- Interactive dashboards allowing users to select a stock, view its sentiment history, and observe how it aligns with price action.
Project 5: Financial Sentiment & Price Correlation Engine Codes:
🔗 View Project Code on GitHubHow to Run the Project:
- Get NewsAPI Key:
- Go toNewsAPI.organd sign up for a free developer account.
- Find your API key on your dashboard.
- Replace
"YOUR_NEWS_API_KEY"in theapp.pyscript with your actual API key.
Run the ETL and Analysis Pipeline: Save the code above as app.py (or any other .py file) and then run it from your terminal:Bash
python app.py
The script will fetch data, perform sentiment analysis, load data into financial_sentiment_analytics.db, calculate correlations, and then display several plots showing the sentiment and price trends. Close the plot windows to allow the script to finish execution.
Install Dependencies: Open your terminal or command prompt and run:Bash
pip install requests pandas sqlalchemy yfinance matplotlib seaborn nltk
The script will automatically download the necessary NLTK data (vader_lexicon) the first time it runs.
Next Steps & Improvements:
- Advanced Sentiment Analysis:
- For more accurate financial sentiment, consider fine-tuning a pre-trained language model like
FinBERT(requires more setup and computational resources). - Implement entity recognition to link sentiment directly to specific companies mentioned in news.
- For more accurate financial sentiment, consider fine-tuning a pre-trained language model like
- Real-time Processing: Integrate with message queues (e.g., Kafka, RabbitMQ) for real-time news ingestion and sentiment scoring.
- More Sophisticated Correlation:
- Explore time-lagged correlations to see if sentiment leads or lags price movements.
- Use Granger Causality tests to determine if sentiment "causes" price changes in a statistical sense.
- Incorporate other market data (e.g., volume, volatility) into the analysis.
- Interactive Dashboard: Build a web-based dashboard using
StreamlitorPlotly Dashto allow users to select different stocks, view sentiment trends, and customize correlation analyses interactively. - Trading Strategy Integration: Use the sentiment and correlation insights to generate automated buy/sell signals for a simulated trading environment.
- Cloud Deployment: For a production system, deploy components on cloud platforms (e.g., AWS Lambda for news extraction, RDS for PostgreSQL/MongoDB, EC2 for analysis/dashboard).
- Data Quality and Deduplication: Implement more robust checks to prevent duplicate news entries, especially if fetching from multiple sources or frequently.
This comprehensive code provides a strong foundation for your Financial Sentiment & Price Correlation Engine.
🚀 Ready to turn raw data into real-world intelligence and career-defining impact?
At Huebits, we don’t just teach Data Science — we train you to build end-to-end solutions that power predictions, automate decisions, and drive business outcomes.
From fraud detection to personalized recommendations, you'll gain hands-on experience working with messy datasets, training ML models, and deploying full-stack data systems — where real-world complexity meets production-grade precision.
🧠 Whether you're a student, aspiring data scientist, or career shifter, our Industry-Ready Data Science Engineering Program is your launchpad.
Master Python, Pandas, Scikit-learn, TensorFlow, Power BI, SQL, and cloud deployment — while building job-grade ML projects that solve real business problems.
🎓 Next Cohort Launching Soon!
🔗 Join Now and become part of the Data Science movement shaping the future of business, finance, healthcare, marketing, and AI-driven industries across the ₹1.5 trillion+ data economy.
📈 6. Social Media Performance Tracker
🔍 Project Overview:
This ETL pipeline is meticulously designed to automate the monitoring and analysis of performance metrics from popular social media platforms, such as Instagram, Facebook, YouTube, and potentially others like X (formerly Twitter) or LinkedIn. Its core function is to systematically extract raw performance data, transform it into meaningful, actionable insights, and then deliver these insights to a centralized repository or a visualization layer.
The pipeline tracks a comprehensive set of metrics including post-level engagement (likes, comments, shares, saves), follower growth, content reach and impressions, video watch time, and audience demographics (where available). By analyzing trends over time and cross-referencing various data points, this system provides a holistic view of social media efficacy. It is an ideal solution for digital marketers, content creators, social media agencies, and businesses aiming to track their Return on Investment (ROI) from social media efforts in near real-time. This project is about turning ephemeral "likes" and "views" into tangible strategic "leverage."
⚙️ Tech Used:
- Languages: Python
- Rationale: Python's robust libraries for API interaction (
requests), data manipulation (Pandas), and visualization (Matplotlib,Plotly,Seaborn) make it the ideal language for building the entire ETL process. Its extensive community support and readability further streamline development and maintenance.
- Rationale: Python's robust libraries for API interaction (
- APIs:
- Meta Graph API (for Instagram/Facebook): This is the primary interface for accessing data from Facebook and Instagram professional accounts. It allows programmatic access to insights like post impressions, reach, engagement rates, follower counts, and audience demographics. Proper authentication (access tokens) and understanding of API rate limits are crucial.
- YouTube Data API: Used to retrieve channel and video-level analytics, including views, likes, comments, subscriber counts, watch time, and audience retention metrics for YouTube channels.
- (Optional: X (formerly Twitter) API, LinkedIn Marketing API, TikTok for Developers API, etc., for broader coverage).
- Database:
- PostgreSQL: A powerful and highly reliable relational database well-suited for storing structured time-series data like social media metrics. It handles complex queries efficiently, provides robust data integrity, and is easily integrated with BI tools for dashboarding. It's scalable for handling growing volumes of historical performance data.
- Google Sheets API: An excellent alternative for simpler projects or for scenarios where sharing data with non-technical users in a familiar spreadsheet format is a priority. It's easy to integrate and requires minimal setup for data storage and retrieval. While less scalable than PostgreSQL for very large datasets, it offers quick visibility and collaboration.
Libraries:
- Pandas: The workhorse for data cleaning, transformation, aggregation (e.g., calculating daily/weekly averages, summing metrics), and creating time-series datasets from the raw API responses.
- Matplotlib, Plotly, Seaborn:
- Matplotlib/Seaborn: For generating static, high-quality plots to visualize trends (e.g., follower growth over time, engagement rate by content type), distributions, and comparisons.
- Plotly: Essential for creating interactive and dynamic charts (e.g., line charts with zoom, bar charts with hover effects) that can be embedded in web dashboards, allowing users to explore data in detail.
- Requests: For making HTTP requests to interact with the various social media APIs.
- (For Google Sheets API):
gspreadorgoogle-api-python-client: Libraries for interacting with Google Sheets programmatically. - Dashboarding (Optional):
- Apache Superset: An open-source, powerful, and modern data exploration and visualization platform. It connects to various databases (like PostgreSQL) and allows users to build highly customizable dashboards with minimal code.
- Google Data Studio (Looker Studio): A free, cloud-based data visualization tool from Google. It connects seamlessly with Google Sheets (and other data sources) and provides intuitive drag-and-drop functionality for creating interactive reports and dashboards.
💼 Use Cases:
- Influencer Analytics Tools for Campaigns: Provides brands and agencies with a detailed breakdown of an influencer's performance (reach, engagement, audience demographics) across various posts and campaigns, aiding in selection and ROI measurement.
- Weekly Engagement Report Generators: Automates the creation of comprehensive reports summarizing key performance indicators (KPIs) like average engagement rate, top-performing posts, and follower growth for internal teams or clients.
- Follower Growth Forecasting: By analyzing historical growth patterns and content performance, the pipeline can provide estimates for future follower growth, aiding in goal setting and strategic planning.
- Competitor Benchmarking on Social Reach: Enables businesses to track the social media performance of their competitors (where public data is available), providing insights into industry trends and competitive advantages.
- Campaign-Level ROI Tracking: Connects social media metrics directly to campaign objectives, allowing marketers to determine the effectiveness and return on investment for specific social media campaigns or content initiatives.
- Content Strategy Optimization: Identifies which types of content (e.g., video vs. image, short-form vs. long-form, specific themes) resonate most with the audience, guiding future content creation.
- Audience Demographics & Persona Refinement: Provides data on audience age, gender, location, and interests (if available via API), helping refine target audience personas.
📈 Impact / ROI:
- 📊 Gives Marketing Teams Instant Insight into What’s Working: Provides immediate, data-driven feedback on content performance, allowing marketers to quickly pivot strategies, optimize campaigns, and allocate resources more effectively.
- 🧠 Powers Smarter Ad Spend Based on Organic Engagement: By understanding what content naturally resonates, businesses can create more effective paid ad campaigns, reducing wasted ad spend and increasing conversion rates.
- 🔁 Saves Time with Automated Reports: Eliminates manual data extraction, aggregation, and report generation, freeing up valuable marketing team hours for strategic planning and creative execution.
- 💼 Helps Agencies Justify Deliverables to Clients: Provides concrete, quantitative proof of performance, enhancing transparency and strengthening client relationships by demonstrating the value delivered.
- 🎯 Enables A/B Testing of Content Based on Real-Time Feedback: Marketers can experiment with different content formats, messaging, or posting times and immediately see which variations yield superior engagement, leading to continuous improvement.
- 📈 Supports Scalable Growth Strategies: By having a clear understanding of what drives performance, businesses can make data-backed decisions for scaling their social media efforts, whether through increased content volume or new platform expansion.
- 🕵️ Identifies Trends & Anomalies: Quickly spots sudden spikes or drops in engagement, allowing for prompt investigation and response to either capitalize on viral content or address issues.
🌐 Real-World Example:
This project is a simplified, yet functionally robust, internal version of the sophisticated dashboards and analytics platforms offered by leading social media management tools:
- Hootsuite: A widely used social media management platform that provides comprehensive dashboards for tracking performance across multiple platforms, scheduling posts, and analyzing engagement.
- Sprout Social: Offers advanced social media analytics, reporting, and listening tools, helping brands understand their audience, measure campaign effectiveness, and track brand sentiment.
- Buffer: Known for its intuitive scheduling and analytics features, providing users with insights into their post performance and audience engagement.
These companies built their business on effectively ingesting post-level data from various social APIs, transforming it into meaningful metrics, and visualizing these insights for their users. This project demonstrates the core engineering capabilities required to build such a system.
🚀 Results:
- ✅ Extracts daily data: likes, comments, shares, impressions: The ETL pipeline successfully connects to and pulls daily (or hourly/post-level, depending on API limits and project scope) metrics for defined social media accounts, including raw counts of likes, comments, shares, saves, video views, impressions (total times content was displayed), and reach (unique users who saw the content).
- ✅ Transforms raw metrics into engagement rates, growth trends: This is where raw numbers become actionable. The pipeline calculates derived KPIs such as:
- Engagement Rate: (Likes + Comments + Shares) / Impressions or Reach.
- Follower Growth Rate: Daily/Weekly percentage increase in followers.
- Video Completion Rate: (for YouTube).
- Audience Retention.
- Data is aggregated by day, week, or month, and normalized for consistent comparison.
- ✅ Loads insights into PostgreSQL or dashboarding tool: The cleaned, transformed, and aggregated metrics are efficiently loaded into PostgreSQL for long-term storage and complex querying, or directly pushed to Google Sheets for immediate visibility and collaboration. If a dashboarding tool like Superset or Data Studio is used, it directly consumes data from these sources.
- ✅ Automates reporting over custom time windows (7-day, 30-day): The system is configured to automatically generate and refresh reports for various time periods (e.g., last 7 days, last 30 days, month-to-date), eliminating manual effort and ensuring stakeholders always have access to up-to-date performance summaries.
- ✅ Tracks top-performing content and audience behavior over time: The analytics layer enables identification of specific posts or content types that achieved the highest engagement. It also facilitates the tracking of how audience behavior (e.g., peak engagement times, preferred content formats) evolves over weeks and months, providing crucial insights for refining content strategy.
Project 6: Social Media Performance Tracker Codes:
🔗 View Project Code on GitHubHow to Run the Project:
Run the ETL Pipeline: Save the code above as app.py (or any other .py file) and then run it from your terminal:Bash
python app.py
The script will generate simulated data, process it, load it into social_media_analytics.db, and then display several plots showing follower growth and engagement trends. Close the plot windows to allow the script to finish execution.
Install Dependencies: Open your terminal or command prompt and run:Bash
pip install pandas sqlalchemy matplotlib seaborn
If you decide to use PostgreSQL later, you'll also need psycopg2-binary:Bash
pip install psycopg2-binary
For Google Sheets, you'd need gspread and google-api-python-client.
Next Steps & Improvements:
- Real API Integration: Replace the
extract_social_media_datafunction with actual API calls to Meta Graph API, YouTube Data API, X API, etc. This will require setting up developer accounts and handling authentication (OAuth 2.0 tokens). - Workflow Orchestration: For a production pipeline, use Apache Airflow (as mentioned in your overview) to schedule and manage the daily execution of these ETL tasks.
- Advanced KPIs: Calculate more sophisticated metrics like:
- Cost Per Engagement (if integrated with ad spend data).
- Audience demographics analysis (if available via API).
- Sentiment analysis on comments (requires NLP libraries).
- Interactive Dashboarding: Connect your database (SQLite, PostgreSQL) to a BI tool like Apache Superset or Google Data Studio (Looker Studio) to create dynamic, interactive dashboards for detailed analysis and reporting.
- Alerting System: Implement alerts for significant changes in metrics (e.g., sudden drop in engagement, rapid follower growth) to notify marketing teams.
- Content Performance Analysis: Extend the data model to include individual post details and analyze which content types, themes, or posting times lead to the highest engagement.
- Scalability: For very large datasets, consider cloud-based data warehouses like Google BigQuery or AWS Redshift.
This code provides a strong foundation for building your comprehensive Social Media Performance Tracker.
🛠️ 7. Industrial IoT Data ETL Pipeline

🔍 Project Overview:
This project entails the construction of a robust, real-time ETL pipeline specifically designed to ingest and process high-velocity, high-volume sensor data streaming from Industrial IoT (IIoT) devices. These devices, embedded within factories, machines, and critical infrastructure, generate continuous streams of telemetry such as temperature readings, vibration patterns, gas levels, pressure, motor RPMs, and energy consumption.
The pipeline's core objectives are multifaceted:
- Real-Time Monitoring: To provide immediate visibility into the operational status and health of machinery and industrial processes.
- Anomaly Detection: To identify deviations from normal operating parameters (e.g., sudden temperature spikes, unusual vibration patterns) that could indicate impending equipment failure or safety hazards.
- Operational Efficiency Enhancement: To provide data-driven insights that optimize machine performance, reduce energy consumption, and streamline production processes.
This is achieved by extracting raw sensor signals, transforming them into actionable metrics (e.g., rolling averages, deviation from baseline, calculated efficiencies), and loading them into a purpose-built time-series database. The final output is a dynamic monitoring system that acts as the digital nervous system of smart manufacturing, enabling proactive decision-making and automated responses.
⚙️ Tech Used:
- Languages: Python
- Rationale: Python's versatility, extensive libraries for networking, data processing, and integration with various databases and APIs make it an excellent choice for building the core logic of the ETL pipeline, including MQTT client implementation and data transformation.
- Protocols:
- MQTT (Message Queuing Telemetry Transport): A lightweight, publish-subscribe messaging protocol designed for constrained devices and low-bandwidth, high-latency, or unreliable networks. It's the industry standard for IIoT data transmission due to its efficiency and reliability for sensor data.
- (or HTTP): While less efficient for continuous streaming, HTTP (via REST APIs) might be used for pulling configuration data, command and control, or less time-sensitive batch data from certain devices.
- Broker: Mosquitto
- Rationale: An open-source MQTT broker that acts as an intermediary between IoT devices (publishers) and data consumers (subscribers, i.e., our ETL pipeline). It handles message routing, security, and persistence, ensuring reliable data delivery from thousands of devices. It's lightweight and efficient, suitable for both development and production environments.
- Database: InfluxDB
- Rationale: A high-performance open-source time-series database (TSDB) specifically optimized for handling large volumes of time-stamped data generated by IoT devices. Its specialized indexing for time, efficient data compression, and powerful query language (Flux or InfluxQL) are critical for fast writes and analytical queries on sensor data.
- Visualization: Grafana
- Rationale: A leading open-source platform for data visualization and monitoring. It integrates seamlessly with InfluxDB (and many other data sources) to create dynamic, real-time dashboards with graphs, gauges, and alerts. Its flexible query editor and wide range of panel options are perfect for visualizing complex sensor data and operational KPIs.
- Extras:
- Telegraf (optional for metric collection): An open-source server agent developed by InfluxData for collecting and sending metrics and events from various sources (systems, databases, IoT devices) to InfluxDB. It can simplify the initial data ingestion step, particularly when pulling metrics from system-level sources or other data formats.
- Pandas: Essential for in-pipeline data cleaning, aggregation, resampling, and deriving new metrics from the raw sensor readings before loading them into InfluxDB.
💼 Use Cases:
- Smart Factory Machine Monitoring: Provides real-time visibility into the operational status, health, and performance of individual machines or entire production lines, helping identify bottlenecks and inefficiencies.
- Predictive Maintenance (Detecting Early Failure Signs): Analyzes vibration anomalies, temperature creep, or unusual current draws to predict impending equipment failures before they occur, enabling scheduled maintenance instead of costly breakdowns.
- Asset Utilization Analytics: Tracks the uptime, downtime, and operational cycles of machinery to optimize asset usage, identify underutilized equipment, and improve overall capital efficiency.
- Real-Time Dashboard for Factory Floor Managers: Offers intuitive, customizable dashboards on a shop floor or control room, providing managers with critical operational KPIs at a glance to make immediate decisions.
- Emission/Safety Compliance Tracking: Monitors gas levels, particulate matter, or other environmental sensors to ensure compliance with regulatory standards and enhance worker safety.
- Quality Control & Process Optimization: Correlates sensor data with product quality metrics to identify process parameters that lead to optimal output or detect anomalies affecting quality.
- Energy Management: Tracks energy consumption patterns of individual machines or factory zones, identifying opportunities for efficiency improvements and cost reduction.
📈 Impact / ROI:
- ⏱️ Reduces Machine Downtime Through Early Detection: By predicting failures, maintenance can be performed proactively, shifting from reactive (break-fix) to predictive maintenance, dramatically reducing unplanned outages and associated production losses.
- 🔧 Extends Equipment Lifespan: Proactive maintenance and optimal operating conditions (informed by sensor data) reduce wear and tear, significantly extending the operational life of expensive industrial assets.
- 📉 Cuts Operational Costs with Optimized Performance: Identifying and addressing inefficiencies (e.g., suboptimal machine settings, energy waste) leads to direct reductions in electricity, maintenance, and labor costs.
- ⚙️ Improves Overall Equipment Effectiveness (OEE): OEE, a key metric in manufacturing, is enhanced by reducing downtime, improving performance (speed), and ensuring quality output – all directly influenced by insights from this pipeline.
- 🧠 Powers Smart Decision-Making in High-Risk Industries: Provides critical real-time data for industries where safety and reliability are paramount (e.g., oil & gas, mining, nuclear), enabling rapid response to potential hazards.
- 💲 Enables New Business Models (e.g., Equipment-as-a-Service): For equipment manufacturers, this pipeline can enable offering service-level agreements or performance-based contracts, backed by real-time operational data.
🌐 Real-World Example:
This project directly mirrors the foundational data infrastructure found in leading Industrial IoT platforms and smart manufacturing solutions deployed by global industrial giants:
- Siemens (MindSphere): Siemens' open IoT operating system connects industrial equipment, analyses data, and generates insights to optimize production processes, enable predictive maintenance, and enhance asset performance across various industries.
- Honeywell (Forge): Honeywell's enterprise performance management platform for industrial operations leverages real-time data from sensors and systems to optimize operations, improve safety, and enhance efficiency in buildings, factories, and supply chains.
- GE (Predix): GE Digital's platform is designed to connect industrial assets, collect data from them, and apply analytics to drive operational improvements and new business models like "outcomes-as-a-service."
These companies rely on similar ETL pipelines to ingest vast quantities of real-time sensor telemetry, process it for immediate insights, and display it live to factory operators, engineers, and integrate it with advanced AI-based automation systems.
🚀 Results:
- ✅ Extracts live sensor readings via MQTT (e.g., temperature, vibration, gas): A Python-based MQTT client subscribes to specific topics on the Mosquitto broker, continuously receiving high-frequency sensor data payloads (e.g., JSON objects containing
device_id,timestamp,sensor_type,value). - ✅ Transforms raw signals into rolling averages, alerts, and normalized logs: The ingested data undergoes real-time processing. This includes:
- Data Cleaning: Handling missing values, unit conversions.
- Feature Engineering: Calculating rolling averages (e.g., 5-minute temperature average), rate of change (e.g., vibration acceleration), or statistical aggregates (min/max/std dev) over time windows.
- Thresholding/Alert Logic: Implementing rules to identify when values exceed predefined safety or operational thresholds, flagging them as anomalies or potential issues.
- Normalization: Structuring data consistently for storage in InfluxDB (e.g., adding tags for device, location).
- ✅ Loads time-series data into InfluxDB: The transformed and enriched sensor data is efficiently written to InfluxDB, leveraging its optimized ingestion for time-series points. Each data point includes the measurement, tags (metadata like
device_id,location,sensor_type), fields (the actual sensor values), and a precise timestamp. - ✅ Streams Grafana dashboards with alerts for out-of-range values: Grafana queries InfluxDB in real-time, visualizing metrics through dynamic dashboards. Gauges show current values, line charts display historical trends, and built-in alerting features within Grafana trigger notifications (e.g., email, Slack, PagerDuty) when sensor readings or derived metrics exceed defined thresholds.
- ✅ Enables integrations for automated equipment control or notifications: The real-time insights and anomaly detection capabilities form the basis for further automation. This could involve sending commands back to actuators (e.g., "reduce motor speed"), triggering maintenance work orders in an ERP system, or initiating automated notifications to relevant personnel for immediate intervention.
Project 7: Industrial IoT Data ETL Pipeline Codes:
🔗 View Project Code on GitHubHow to Run the Project:
To get this pipeline running, you need to set up three main components:
- Set up Mosquitto MQTT Broker:
- Download: Go to theMosquitto websiteand download the appropriate installer for your operating system.
- Install: Follow the installation instructions.
- Run: Start the Mosquitto broker. On most systems, it runs as a service in the background after installation. You can verify it's running by checking its service status or by trying to connect to it.
- Default Port: Mosquitto typically runs on port
1883, which is configured in the Python script.
- Set up InfluxDB:
- Download: Go to theInfluxData websiteand download InfluxDB (version 2.x is recommended for this code).
- Install & Setup: Follow the installation and initial setup instructions for InfluxDB. During the initial setup, you will be prompted to create an organization, a bucket, and an API token. Make sure to save this API token, as you'll need it for the Python script.
- Run: Start the InfluxDB service. It usually runs on port
8086. - Update Configuration: Crucially, update the
INFLUXDB_URL,INFLUXDB_TOKEN, andINFLUXDB_ORGvariables in theapp.pyscript with the values you obtained during InfluxDB setup. TheINFLUXDB_BUCKETshould match the bucket name you want to use (the script will try to create it if it doesn't exist).
- Set up Grafana (for Visualization):
- Download: Go to theGrafana websiteand download the appropriate installer.
- Install & Run: Follow the installation instructions and start the Grafana service. It typically runs on port
3000. - Add Data Source:
- Open Grafana in your web browser (usually
http://localhost:3000). - Log in (default: admin/admin, then you'll be prompted to change it).
- Go to "Connections" -> "Add new connection" -> search for "InfluxDB".
- Configure the InfluxDB data source:
- Query Language: Flux
- URL:
http://localhost:8086(or your InfluxDB URL) - Auth: "Token"
- Token: Paste your InfluxDB API token.
- Organization: Enter your InfluxDB organization name.
- Default Bucket: Enter
iiot_sensor_data(or your chosen bucket name). - Click "Save & Test".
- Open Grafana in your web browser (usually
- Create Dashboard:
- Go to "Dashboards" -> "New Dashboard" -> "Add new panel".
- Select your InfluxDB data source.
- Use the Flux query builder or write Flux queries to visualize your data (e.g.,
from(bucket: "iiot_sensor_data") |> range(start: -5m) |> filter(fn: (r) => r._measurement == "temperature") |> yield(name: "temperature")). - You can add panels for
value,rolling_avg, andis_anomalyfor each sensor type and device.
Run the Python Script: Save the code above as app.py (or any other .py file) and then run it from your terminal:Bash
python app.py
You will see messages indicating the MQTT connection, data reception, and InfluxDB writes. The sensor simulator will continuously publish data.
Install Python Dependencies: Open your terminal or command prompt and run:Bash
pip install paho-mqtt influxdb-client numpy
Next Steps & Improvements:
- Robust Anomaly Detection: Implement more advanced anomaly detection algorithms (e.g., statistical process control, machine learning models like Isolation Forest or autoencoders) instead of a simple standard deviation threshold.
- Data Persistence for Buffers: For a production system, consider persisting the rolling average buffers to disk or a fast cache (like Redis) to handle application restarts gracefully.
- Scalability:
- For very high-volume data, consider using a message queue like Apache Kafka between the MQTT broker and the ETL processing to buffer data and decouple services.
- Deploy the ETL pipeline components as microservices in a containerized environment (Docker, Kubernetes).
- Error Handling and Logging: Implement more comprehensive
try-exceptblocks and detailed logging using Python'sloggingmodule for better monitoring and debugging in production. - Security: For a real IIoT deployment, implement robust security measures for MQTT (TLS/SSL, authentication) and InfluxDB (user management, fine-grained permissions).
- Command & Control: Extend the system to send commands back to devices via MQTT based on detected anomalies or operational needs.
- Integration with Maintenance Systems: Automatically trigger work orders in a Computerized Maintenance Management System (CMMS) when a predictive maintenance anomaly is detected.
This code provides a strong foundation for building your Industrial IoT Data ETL Pipeline.
🚀 Ready to turn raw data into real-world intelligence and career-defining impact?
At Huebits, we don’t just teach Data Science — we train you to build end-to-end solutions that power predictions, automate decisions, and drive business outcomes.
From fraud detection to personalized recommendations, you'll gain hands-on experience working with messy datasets, training ML models, and deploying full-stack data systems — where real-world complexity meets production-grade precision.
🧠 Whether you're a student, aspiring data scientist, or career shifter, our Industry-Ready Data Science Engineering Program is your launchpad.
Master Python, Pandas, Scikit-learn, TensorFlow, Power BI, SQL, and cloud deployment — while building job-grade ML projects that solve real business problems.
🎓 Next Cohort Launching Soon!
🔗 Join Now and become part of the Data Science movement shaping the future of business, finance, healthcare, marketing, and AI-driven industries across the ₹1.5 trillion+ data economy.
📦 8. Supply Chain ETL for Real-Time Inventory

🔍 Project Overview:
This ETL pipeline is engineered to be the central nervous system for modern retail and logistics operations, specifically focusing on real-time inventory management. It's designed to ingest and unify inventory data from disparate sources, often stemming from multiple warehouse locations, retail stores, or even third-party logistics (3PL) providers. The core problem it solves is the common challenge of fragmented inventory views, which leads to stockouts, overstocks, and inaccurate customer promises.
The pipeline performs:
- Extraction: Collecting raw inventory quantities, location data, product attributes, and movement logs from various source systems (e.g., Warehouse Management Systems (WMS), Enterprise Resource Planning (ERP) systems).
- Transformation: Cleansing the data, standardizing formats, resolving discrepancies (e.g., unit of measure conversions, reconciling stock discrepancies), removing duplicates, and enriching it with additional context (e.g., product hierarchy, supplier information).
- Loading: Consolidating this refined, accurate inventory data into a single, unified data warehouse or analytical database.
The ultimate goal is to provide a consistent, accurate, and near real-time view of product availability across the entire supply chain. This empowers businesses to identify overstock situations, detect potential out-of-stock scenarios proactively, monitor fulfillment health, and automate critical supply chain decisions. This pipeline is the digital bloodstream that ensures smooth product flow in modern retail.
⚙️ Tech Used:
- Languages: Python
- Rationale: Python remains a crucial language for custom scripting within ETL tools (like Talend or NiFi for custom processors), developing data quality checks, performing complex transformations not easily handled by GUI tools, and connecting to various APIs or niche data sources.
- ETL Tool:
- Talend: A powerful, open-source, and commercial data integration platform. It provides a rich graphical interface for designing complex ETL jobs, connecting to a vast array of data sources, and managing job orchestration. Its code generation capabilities often leverage Java, but Python can be integrated.
- (or Apache NiFi for open-source option): A robust open-source system for automating data flow between systems. NiFi's flow-based programming approach is excellent for real-time data ingestion, routing, and transformation, making it highly suitable for streaming inventory updates from diverse sources. It excels at managing data provenance and guaranteed delivery.
- Databases:
- MySQL (source): Represents typical operational databases used by individual warehouse management systems (WMS) or legacy inventory systems. It serves as the primary source of raw inventory data.
- Snowflake / AWS Redshift (target):
- Snowflake: A cloud-native, highly scalable, and flexible data warehouse. Its architecture separates compute from storage, allowing for independent scaling and cost-efficiency. It's excellent for analytical workloads, handling large volumes of historical and real-time inventory data for comprehensive reporting.
- AWS Redshift: Amazon's fully managed, petabyte-scale data warehouse service. It's optimized for analytical queries on large datasets and integrates seamlessly with other AWS services. Both Snowflake and Redshift are ideal for building a unified inventory data mart.
- Scheduler:
- Talend Studio: Provides built-in scheduling capabilities for jobs designed within its environment, allowing for periodic execution of ETL pipelines.
- Airflow (optional): For more complex, dependent, and robust orchestration across multiple ETL jobs, microservices, and potential machine learning workflows (e.g., for demand forecasting that influences inventory), Apache Airflow is an industry standard. It offers powerful DAG management, monitoring, and recovery features.
- Dashboards:
- Tableau: A leading business intelligence and data visualization tool. It connects robustly to data warehouses like Snowflake/Redshift, enabling the creation of highly interactive, detailed, and visually appealing dashboards for inventory management.
- Looker: A modern, web-based business intelligence platform (now part of Google Cloud) known for its strong data modeling layer (LookML) and in-database analytics. It provides a unified view of data and powerful exploration capabilities for business users.
💼 Use Cases:
- Multi-Location Inventory Sync: Ensures that inventory counts are consistent and accurate across all sales channels (e-commerce, brick-and-mortar), warehouses, and distribution centers.
- Out-of-Stock and Overstock Detection: Automatically flags SKUs (Stock Keeping Units) that are critically low or excessively high, triggering alerts for replenishment or promotional activities.
- Supplier/Vendor Fill-Rate Dashboards: Monitors the performance of suppliers based on their ability to fulfill orders and restock inventory, aiding in vendor management and negotiation.
- Cross-Border Inventory Movement Tracking: Provides visibility into products moving between international warehouses or fulfillment centers, accounting for transit times and customs.
- Real-Time Restock Automation Triggers: Based on predefined thresholds and demand forecasts, the pipeline can trigger automated purchase orders or internal transfer requests to replenish stock.
- Demand Planning & Forecasting Input: The unified inventory data provides a critical input for more accurate sales forecasts and demand planning models.
- Order Fulfillment Optimization: Directs customer orders to the warehouse with available stock closest to the customer, minimizing shipping costs and delivery times.
📈 Impact / ROI:
- 📦 Reduces Order Cancellations Due to Stock Mismatches: Accurate, real-time inventory data means fewer instances of customers ordering products that are actually out of stock, leading to higher order fulfillment rates and happier customers.
- 🛍️ Improves Customer Satisfaction Through Accurate Availability: Customers see reliable stock information online, leading to greater trust, fewer disappointments, and repeat purchases.
- 📉 Cuts Warehousing Costs by Optimizing Stock Levels: Prevents overstocking (which incurs storage costs, obsolescence risk, and capital tie-up) and minimizes expedited shipping costs from stockouts.
- 🚚 Enhances Supply Chain Resilience and Agility: With a clear, unified view of inventory, businesses can react much faster to disruptions (e.g., supplier issues, unexpected demand spikes) by re-routing stock or adjusting procurement.
- 🔄 Enables Real-Time Decision-Making for Procurement Teams: Procurement managers have instant access to demand signals and stock levels, allowing them to make timely, data-driven decisions on purchasing quantities and schedules.
- 💲 Maximizes Sales Opportunities: Ensures that available inventory is accurately reflected across all sales channels, preventing lost sales due to perceived stockouts or incorrect product listings.
- ⚖️ Aids in Financial Planning: Provides accurate inventory valuations, crucial for financial reporting and working capital management.
🌐 Real-World Example:
This project directly simulates the mission-critical inventory synchronization engines that power the world's largest e-commerce and retail giants:
- Amazon: Operates a hyper-complex global inventory system, constantly syncing data from countless fulfillment centers, vendor warehouses, and inbound shipments to ensure products are available for millions of orders daily. Their ability to predict demand and manage inventory across locations is central to their customer promise and operational efficiency.
- Flipkart (India): Similar to Amazon, Flipkart relies heavily on real-time inventory updates across its vast network of warehouses and seller inventories to fulfill orders efficiently and provide accurate delivery estimates.
- Zara: A pioneer in fast fashion, Zara's entire business model hinges on rapid inventory turnover and dynamic supply chain. They use sophisticated systems to track every garment from design to store shelf, allowing them to quickly restock popular items and pull slow-moving ones, minimizing waste and maximizing responsiveness to trends.
This ETL pipeline builds a simplified, yet functionally robust, internal version of such a system, demonstrating the ability to manage complex data flows essential for operational excellence in supply chain and retail.
🚀 Results:
- ✅ Extracts SKU data from source MySQL databases across warehouses: The pipeline successfully connects to multiple, potentially heterogeneous, MySQL databases (representing different warehouses or legacy systems). It systematically extracts SKU (Stock Keeping Unit) information, current stock levels, location details, and associated product attributes.
- ✅ Transforms formats, removes duplicate entries, maps product hierarchies: The raw extracted data undergoes rigorous cleansing and standardization. This involves:
- Data Type Conversions: Ensuring consistency across databases (e.g.,
INTfor quantities,VARCHARfor SKU codes). - Deduplication: Identifying and removing redundant entries for the same SKU across different sources or within a single source over time.
- Data Enrichment: Joining with product master data to add details like product categories, brands, or dimensions.
- Product Hierarchy Mapping: Standardizing product categorization and ensuring consistent unique identifiers (SKUs) across all systems.
- Data Type Conversions: Ensuring consistency across databases (e.g.,
- ✅ Loads unified data into Snowflake for analytics and cross-site visibility: The clean, transformed, and normalized inventory data is efficiently loaded into the centralized Snowflake (or Redshift) data warehouse. This creates a single source of truth for inventory, accessible for enterprise-wide analytics and reporting.
- ✅ Powers dashboards that display inventory status in real time: Tableau or Looker dashboards are built on top of the unified data warehouse. These dashboards provide dynamic, real-time views of:
- Overall stock levels by product category, warehouse, or region.
- Current stock quantities for individual SKUs.
- In-transit inventory.
- Stockout warnings and overstock alerts.
- Historical inventory trends.
- ✅ Flags slow-moving SKUs, predicts restock points using historical trends: Beyond basic reporting, the pipeline enables more advanced analytics:
- Slow-Moving SKU Identification: By analyzing sales velocity against stock levels, it identifies products that are not selling as quickly as expected, prompting potential clearance sales or inventory adjustments.
- Restock Point Prediction: Using historical sales data and lead times (extracted as part of transformation or external lookup), the system can calculate optimal reorder points and quantities, predicting when and how much to restock to meet anticipated demand while minimizing holding costs. This often forms the basis for automated procurement triggers.
Project 8: Supply Chain ETL for Real-Time Inventory Codes:
🔗 View Project Code on GitHubHow to Run the Project:
- Database Setup:
- For SQLite (default in the code): No special setup is needed. The database file
supply_chain_inventory.dbwill be created automatically in the same directory where you run the script. - For PostgreSQL/MySQL (if you switch):
- Ensure your database server is running.
- Create a new database (e.g.,
inventory_db). - Update the
DATABASE_URLin theapp.pyscript accordingly (e.g.,"postgresql://user:password@host:port/database_name"). - Install the corresponding Python database adapter (e.g.,
psycopg2-binaryfor PostgreSQL,mysqlclientormysql-connector-pythonfor MySQL).
- For SQLite (default in the code): No special setup is needed. The database file
Run the ETL Pipeline: Save the code above as app.py (or any other .py file) and then run it from your terminal:Bash
python app.py
The script will simulate data extraction, perform transformations, load the data into the SQLite database, and then display several plots and print summary reports. Close the plot windows to allow the script to finish execution.
Install Dependencies: Open your terminal or command prompt and run:Bash
pip install pandas sqlalchemy matplotlib seaborn
Next Steps & Improvements:
- Real Data Sources: Replace the
simulate_warehouse_datafunction with actual connectors to your Warehouse Management Systems (WMS), ERP systems, or other inventory databases. This would involve using appropriate database connectors (e.g.,psycopg2,mysql-connector-python) or APIs. - ETL Tool Integration: While this script provides the logic, in a real-world scenario, you would integrate this Python code into an ETL tool like Talend or Apache NiFi for robust job scheduling, monitoring, error handling, and data flow management.
- Advanced Transformation Logic:
- Implement more sophisticated deduplication and reconciliation logic for complex inventory discrepancies.
- Integrate with external master data management (MDM) systems for product hierarchies, supplier information, and location data.
- Calculate advanced KPIs like inventory turnover, days of supply, or fill rates.
- Real-time Updates: For true "real-time" inventory, consider an event-driven architecture where inventory changes (e.g., sales, receipts, movements) trigger immediate updates to the unified data store, potentially using message queues (Kafka, RabbitMQ).
- Scalable Data Warehouse: Migrate from SQLite to a cloud-native data warehouse like Snowflake or AWS Redshift for production-grade scalability, performance, and integration with BI tools.
- Interactive Dashboards: Connect your unified data warehouse (Snowflake/Redshift/PostgreSQL) to a powerful BI tool like Tableau or Looker to create highly interactive, drill-down dashboards for inventory managers, procurement teams, and sales.
- Predictive Analytics: Integrate machine learning models for more accurate demand forecasting, which can then inform dynamic restock points and order quantities.
- Automated Triggers: Based on the flagged overstock/understock conditions or predicted restock points, implement automated triggers for purchase orders, internal transfers, or alerts to relevant teams.
This code provides a strong foundation for building your Supply Chain ETL for Real-Time Inventory.
🏥 9. Health Monitoring Pipeline for Wearables
🔍 Project Overview:
This ETL pipeline is designed as a sophisticated, real-time data processing system that ingests and analyzes continuous streams of biometric data from wearable devices such as smartwatches, fitness bands, and continuous glucose monitors. The data sources typically include raw measurements like heart rate (BPM), SpO2 (blood oxygen saturation), skin temperature, motion data (accelerometer/gyroscope for steps, sleep, activity types), and potentially other vital signs.
The pipeline performs:
- Extraction: Securely collecting raw, high-frequency biometric data from various wearable device APIs or direct device integrations.
- Transformation: Cleansing, normalizing, and enriching this raw data. This involves calculating derived metrics (e.g., Heart Rate Variability (HRV), sleep stages from motion, activity levels), identifying baseline patterns, and detecting deviations or abnormalities against personalized thresholds.
- Loading: Persisting the processed and actionable insights into a highly scalable database optimized for time-series data.
The ultimate objective is to feed these real-time insights into dynamic health dashboards or automated alert systems, enabling a new era of proactive and personalized healthcare. This project epitomizes how to build AI-powered wellness at the edge, empowering individuals and healthcare providers with continuous, data-driven health intelligence.
⚙️ Tech Used:
- Languages: Python
- Rationale: Python's versatility, extensive libraries for data processing (
Pandas), cloud integration (Boto3), and its suitability for machine learning (for advanced anomaly detection) make it an ideal language for building the core logic of this pipeline. It handles diverse data formats and real-time processing needs well.
- Rationale: Python's versatility, extensive libraries for data processing (
- API Gateway:
- AWS API Gateway: A fully managed service that allows developers to create, publish, maintain, monitor, and secure APIs at any scale. It serves as the secure entry point for wearable devices or their companion apps to push biometric data to the pipeline, handling authentication, throttling, and routing to backend Lambda functions.
- Firebase (Firestore/Realtime Database): For simpler mobile app integrations, Firebase can serve as both an API gateway (through its SDKs) and a NoSQL database. It offers real-time data synchronization, making it suitable for quick prototyping of health apps sending data directly.
- Database:
- DynamoDB: AWS's fully managed, serverless NoSQL database. It offers single-digit millisecond performance at any scale, making it excellent for high-volume, low-latency ingestion of individual biometric data points from many users. Its flexible schema is suitable for varying sensor data.
- InfluxDB: A high-performance open-source time-series database (TSDB). It's purpose-built for handling massive streams of time-stamped data, like sensor readings. Its optimized storage, querying, and native support for time-based aggregations make it an ideal choice for detailed historical analysis and real-time visualization of biometric trends.
- ETL Layer:
- Lambda Functions (serverless processing): AWS Lambda allows you to run code without provisioning or managing servers. This is perfect for event-driven processing of wearable data:
- An API Gateway trigger invokes a Lambda function on data reception.
- The Lambda function performs immediate data cleaning, validation, initial transformation (e.g., unit conversion), and loads data into DynamoDB or InfluxDB.
- Another Lambda function (triggered by a stream from DynamoDB or a schedule) can perform more complex aggregations, anomaly detection, or calculations of derived health metrics. This ensures scalability and cost-efficiency.
- Lambda Functions (serverless processing): AWS Lambda allows you to run code without provisioning or managing servers. This is perfect for event-driven processing of wearable data:
- Visualization:
- Kibana: An open-source data visualization dashboard for Elasticsearch. If data is indexed in Elasticsearch (which could be populated from DynamoDB/InfluxDB via another Lambda/connector), Kibana provides powerful real-time dashboards and alerting capabilities.
- Grafana: As seen in Project 7, Grafana is an excellent open-source tool for visualizing time-series data. It integrates natively and powerfully with InfluxDB, allowing for highly customizable, real-time dashboards of heart rate, SpO2, sleep patterns, and anomaly alerts.
- Streamlit: For a custom, Python-native dashboard, Streamlit offers rapid development of interactive web applications, ideal for displaying personalized health metrics and trends pulled from the database.
💼 Use Cases:
- Remote Patient Monitoring (RPM): Enables healthcare providers to continuously monitor patients with chronic conditions (e.g., heart disease, diabetes) from a distance, reducing hospital readmissions and improving patient outcomes.
- Preventive Healthcare Systems: By detecting subtle changes in vital signs or activity patterns, the pipeline can alert individuals or clinicians to potential health issues before they become severe, promoting early intervention.
- Fitness Tracking with Personalized Recommendations: Provides athletes and fitness enthusiasts with detailed insights into their performance, recovery (e.g., sleep quality, HRV), and training load, offering personalized recommendations for optimizing workouts and preventing overtraining.
- Elderly Care Fall Detection + Emergency Response: Motion data analysis can identify falls, automatically triggering alerts to caregivers or emergency services, significantly enhancing safety for the elderly living independently.
- Health Insurance Integrations for Dynamic Risk Profiling: Insurance companies can leverage aggregated, anonymized health data (with user consent) to offer personalized premiums, incentivize healthy behaviors, and better assess risk for policyholders.
- Clinical Research & Public Health Surveillance: Provides a rich dataset for researchers to study physiological responses, disease progression, and the impact of lifestyle changes on health outcomes.
- Corporate Wellness Programs: Offers employees personalized health insights and challenges, encouraging healthier habits and potentially reducing healthcare costs for employers.
📈 Impact / ROI:
- ❤️ Enables Early Detection of Health Issues: The most significant impact. Continuous monitoring allows for the detection of subtle physiological changes that might indicate the onset of a condition, leading to earlier diagnosis and treatment.
- ⏳ Reduces Hospital Visits Via Continuous Monitoring: By providing home-based, proactive monitoring, unnecessary emergency room visits and hospitalizations can be avoided, making healthcare more efficient and less stressful.
- 🔁 Automates Alert Systems for Life-Threatening Changes: Critical deviations (e.g., dangerously high/low heart rate, prolonged inactivity after a fall) can instantly trigger SMS/email alerts to designated contacts (family, doctors, emergency services), potentially saving lives.
- 📉 Cuts Healthcare Costs for Patients and Providers: Proactive care and reduced hospitalizations translate into lower out-of-pocket expenses for patients and decreased operational burdens for healthcare systems.
- 🧠 Enables Data-Driven Wellness Decisions in Real Time: Individuals gain actionable insights into their own health, empowering them to make informed choices about diet, exercise, stress management, and sleep, fostering long-term wellness.
- ⬆️ Improves Quality of Life: For chronic patients or the elderly, the constant monitoring provides a sense of security and improved quality of life by enabling independent living with peace of mind.
🌐 Real-World Example:
This project directly parallels the complex backend systems that power leading consumer health and wellness platforms that manage data from millions of wearables:
- Fitbit Health Solutions: Fitbit collects extensive biometric data from its devices, processes it, and provides users with dashboards for activity, sleep, and heart health. They also offer enterprise solutions for corporate wellness and clinical research, leveraging similar data pipelines.
- Apple Health: The Apple Health ecosystem aggregates data from Apple Watch and various third-party apps, providing users with a comprehensive view of their health metrics, often with anomaly detection capabilities (e.g., irregular heart rhythm notifications).
- WHOOP: Known for its focus on athletic performance and recovery, WHOOP continuously collects heart rate variability (HRV), sleep stages, and recovery metrics, providing daily personalized insights and coaching, all powered by a robust backend data pipeline.
This project simulates a simplified, yet functionally robust, version of the data collection, processing, and alerting infrastructure that these companies utilize to deliver their personalized health and wellness services.
🚀 Results:
- ✅ Extracts continuous biometric streams from devices: The pipeline successfully receives and parses real-time (or near real-time, depending on device sync intervals) biometric data, including timestamped values for heart rate (BPM), SpO2 levels, body temperature, accelerometer data (for activity/sleep), and potentially other sensor readings from simulated or actual wearable device APIs.
- ✅ Transforms raw numbers into insights (e.g., HRV, rest vs. active): The core transformation logic processes the raw data. This includes:
- Data Cleaning: Filtering out noise, handling missing data points.
- Derived Metrics: Calculating Heart Rate Variability (HRV) from R-R intervals, identifying sleep stages (Light, REM, Deep) from motion and heart rate patterns, categorizing physical activity (sedentary, light, moderate, vigorous) based on accelerometer data.
- Baseline Calculation: Establishing personalized normal ranges for vital signs over time.
- Contextualization: Enriching data with user profile information (age, gender, pre-existing conditions).
- ✅ Loads structured data into DynamoDB or time-series DB: The cleaned and transformed biometric insights are efficiently ingested into DynamoDB (for flexible individual records and low-latency access) or InfluxDB (for highly optimized time-series storage and querying). Data is partitioned and indexed appropriately for fast retrieval.
- ✅ Visualizes trends and flags abnormalities in real-time dashboards: Grafana, Kibana, or a custom Streamlit dashboard continuously queries the database to:
- Display live vital signs and activity levels.
- Show historical trends for heart rate, sleep patterns, daily steps, etc.
- Visually highlight any detected abnormalities (e.g., heart rate outside safe zones, sudden drops in SpO2, prolonged inactivity) using color-coding, alert icons, or dedicated anomaly graphs.
- ✅ Supports integration with alert systems (email, SMS, emergency contacts): The anomaly detection results serve as triggers for an automated alert system. This could be implemented via AWS SNS (Simple Notification Service) for SMS/email, or by integrating with a third-party notification service, sending alerts to the user, their designated emergency contacts, or even directly to healthcare providers in critical situations.
Project 9: Health Monitoring Pipeline for Wearables Codes:
🔗 View Project Code on GitHubHow to Run the Project:
Run the Python Script: Save the code above as app.py (or any other .py file) and then run it from your terminal:Bash
python app.py
The script will start simulating data generation and processing. You'll see print statements indicating data being processed and anomalies detected. Let it run for a minute or two to collect some data, then press Ctrl+C to stop the simulation. Once stopped, it will generate and display the health trend plots. Close the plot windows to allow the script to finish execution.
Install Dependencies: Open your terminal or command prompt and run:Bash
pip install pandas numpy sqlalchemy matplotlib seaborn
Next Steps & Improvements:
- Real Wearable API Integration: Replace the
simulate_wearable_datafunction with actual API calls to wearable device platforms (e.g., Apple HealthKit, Google Fit, Fitbit API, Garmin Connect API). This would involve handling authentication (OAuth 2.0) and API rate limits. - Cloud-Native Architecture:
- API Gateway: Use AWS API Gateway as the secure entry point for devices to send data.
- Lambda Functions: Deploy
process_biometric_dataas an AWS Lambda function triggered by API Gateway. - Database: Migrate from SQLite to a scalable NoSQL database like DynamoDB for high-velocity ingestion or a time-series database like InfluxDB (or AWS Timestream) for optimized time-series queries.
- Advanced Anomaly Detection: Implement more sophisticated machine learning-based anomaly detection algorithms (e.g., Isolation Forest, One-Class SVM, or LSTM autoencoders for time-series data) for more accurate and personalized anomaly detection.
- Derived Health Metrics:
- Heart Rate Variability (HRV): Requires raw R-R interval data, which is more complex to simulate but crucial for stress and recovery analysis.
- Sleep Stage Detection: Requires more granular accelerometer and heart rate data, often involving machine learning models trained on labeled sleep data.
- Calorie Burn: Can be estimated from activity level, steps, and user's basal metabolic rate.
- Interactive Dashboards: Connect your database (DynamoDB, InfluxDB, or a data warehouse like Redshift/Snowflake if aggregated) to a BI tool like Grafana, Kibana, or build a custom dashboard using Streamlit to visualize real-time and historical health metrics, trends, and alerts.
- Alerting System: Integrate with notification services (e.g., AWS SNS for SMS/email, Twilio, PagerDuty) to send automated alerts to users, caregivers, or healthcare providers when critical health anomalies are detected.
- User Management & Personalization: For a multi-user system, implement user authentication and store user profiles to personalize baselines and alerts.
- Data Privacy & Security: Implement robust data encryption, access controls, and compliance measures (e.g., HIPAA for healthcare data).
This code provides a strong foundation for building your comprehensive Health Monitoring Pipeline for Wearables.
🚀 Ready to turn raw data into real-world intelligence and career-defining impact?
At Huebits, we don’t just teach Data Science — we train you to build end-to-end solutions that power predictions, automate decisions, and drive business outcomes.
From fraud detection to personalized recommendations, you'll gain hands-on experience working with messy datasets, training ML models, and deploying full-stack data systems — where real-world complexity meets production-grade precision.
🧠 Whether you're a student, aspiring data scientist, or career shifter, our Industry-Ready Data Science Engineering Program is your launchpad.
Master Python, Pandas, Scikit-learn, TensorFlow, Power BI, SQL, and cloud deployment — while building job-grade ML projects that solve real business problems.
🎓 Next Cohort Launching Soon!
🔗 Join Now and become part of the Data Science movement shaping the future of business, finance, healthcare, marketing, and AI-driven industries across the ₹1.5 trillion+ data economy.
🔍 10. AI Job Trends Scraper + ETL System
🔍 Project Overview:
This project aims to build an end-to-end ETL (Extract, Transform, Load) pipeline dedicated to uncovering real-time trends within the dynamic Artificial Intelligence (AI) and Machine Learning (ML) job market. The system functions by systematically scraping job listings from various online career portals (e.g., Indeed, LinkedIn Jobs, specialized AI job boards like AI-Jobs.net, DataScienceJobs.com).
The pipeline's core functionality includes:
- Extraction: Programmatically visiting job board URLs and extracting raw HTML content, focusing on job titles, descriptions, company names, locations, posted dates, and crucially, any mentioned salary ranges or benefits.
- Transformation: Parsing the extracted unstructured text data into a structured, clean format. This involves natural language processing (NLP) techniques to identify key skills (e.g., Python, TensorFlow, PyTorch, Kubernetes, SQL), extract roles (e.g., Machine Learning Engineer, Data Scientist, AI Researcher, NLP Specialist), normalize locations, and accurately parse salary figures, converting them to a common currency and annual range where possible. It also handles de-duplication of job postings.
- Loading: Storing this highly structured and enriched job data into a relational database, making it readily available for analytical querying and visualization.
The ultimate goal is to provide actionable intelligence to a diverse audience: learners seeking to identify in-demand skills, career coaches advising on optimal career paths, recruiters looking for hiring hotspots, and educational institutions needing to benchmark their curriculum against live market demand. This project acts as a powerful, self-built "LinkedIn analytics" or "Indeed Hiring Lab" equivalent for the AI/ML domain, giving users a significant edge in a fiercely competitive landscape.
⚙️ Tech Used:
- Languages: Python
- Rationale: Python is the de-facto standard for web scraping due to its rich ecosystem of libraries. It's also excellent for data processing (
Pandas), database interaction, and integrating with workflow orchestration tools. Its flexibility makes it ideal for handling the diverse and often messy nature of web data.
- Rationale: Python is the de-facto standard for web scraping due to its rich ecosystem of libraries. It's also excellent for data processing (
Libraries:
- Scrapy / BeautifulSoup:
- Scrapy: A powerful, high-level web crawling and scraping framework. It's ideal for building scalable and robust spiders that can efficiently navigate complex websites, handle pagination, and manage request rates. It also offers built-in support for item pipelines to process scraped data.
- BeautifulSoup: A Python library for parsing HTML and XML documents. It's excellent for quickly extracting data from web pages, especially when combined with
Requestsfor fetching the content. It's simpler for less complex scraping tasks or for initial prototyping.
- Requests: For making HTTP requests to fetch web page content. While Scrapy handles this internally,
Requestsis essential if usingBeautifulSoupfor simple fetches. - Pandas: The cornerstone for data cleaning, transformation, and analysis. It will be used to structure the scraped data into DataFrames, perform string manipulations (e.g., extracting skills from text), handle missing values, and aggregate data for trend analysis.
- NLTK / SpaCy (Optional for Advanced NLP): For more sophisticated skill and entity extraction, these NLP libraries can be employed to identify specific technical terms, frameworks, and tools from job descriptions with higher accuracy.
- Database:
- PostgreSQL: A robust, open-source relational database highly suitable for storing structured job listing data. It supports complex queries for trend analysis, has excellent indexing capabilities, and is scalable.
- SQLite: An excellent choice for smaller-scale projects, local development, or when a lightweight, file-based database is preferred. It's very easy to set up and manage, ideal for a portfolio project without external database dependencies.
- Workflow Orchestration:
- Apache Airflow: A powerful open-source platform to programmatically author, schedule, and monitor workflows (DAGs - Directed Acyclic Graphs). It's crucial for automating the daily/weekly scraping, transformation, and loading processes, ensuring reliability, error handling, and retries. It allows for defining dependencies between tasks (e.g., data transformation must run after scraping completes).
- Dashboarding:
- Google Data Studio (Looker Studio): A free, cloud-based data visualization tool. It connects easily to PostgreSQL (or SQLite if integrated via a Google Sheet export) and allows for intuitive drag-and-drop creation of interactive dashboards to display job market trends.
- Streamlit: A Python-native library for rapidly building custom web applications for data science and machine learning. It's excellent for creating interactive dashboards directly from Python, providing a highly customizable and deployable solution, especially for showcasing advanced analytics.
💼 Use Cases:
- Track AI/ML/Data Job Trends by City, Domain, or Skill: Analyze the geographic distribution of AI jobs, identify which industries are hiring most actively, and pinpoint the most sought-after technical and soft skills.
- Discover Top-Paying Job Roles by Scraping Real Salary Data: Provide insights into average salary ranges for different AI/ML roles (e.g., Senior ML Engineer vs. Junior Data Scientist) across various locations and experience levels.
- Build Public Dashboards for Ed-Tech or Placement Cells: Offer valuable, live market intelligence to students, university placement departments, and online course providers, helping them align offerings with industry demand.
- Generate Weekly Newsletters for Hiring Demand: Automate the creation and distribution of summary reports highlighting significant shifts in job volume, emerging roles, or new skill requirements.
- Benchmark Course Offerings Against Live Demand: Educational platforms can use this data to validate or adjust their curriculum, ensuring that the skills they teach are directly relevant to current industry needs.
- Personalized Job Recommendations: For job seekers, the system can recommend jobs based on their skill set and preferences, aligning with real-time market opportunities.
- Competitive Intelligence for Recruiters: Agencies and internal talent acquisition teams can gain insights into where competitors are hiring, for what roles, and what compensation they are offering.
📈 Impact / ROI:
- 🔍 Reveals Emerging Skills and Fading Trends in Hiring: Provides a competitive advantage by identifying new technologies or methodologies gaining traction, allowing for proactive learning or curriculum development.
- 💼 Helps Job-Seekers Tailor Resumes to What Companies Actually Want: Data-backed insights into frequently requested skills and keywords enable job seekers to optimize their resumes and cover letters for specific roles, increasing their chances of landing interviews.
- 🧠 Provides Course Creators and Educators with Data-Backed Curriculum Guidance: Ensures that educational programs are highly relevant, producing graduates with in-demand skills, leading to better employment rates.
- 📊 Builds a Competitive Moat for Training Platforms: A platform that can offer real-time market insights alongside its training content provides unique value, attracting more users.
- 🚀 Powers Targeted Upskilling & Reskilling Campaigns: Organizations can use these insights to design internal training programs that address skill gaps identified in the market, ensuring their workforce remains competitive.
- 💰 Facilitates Salary Negotiation: Job seekers can enter salary negotiations armed with data on typical compensation ranges for their desired roles and locations.
🌐 Real-World Example:
This project conceptually mirrors the sophisticated data intelligence engines operated by major players in the HR tech and talent analytics space:
- HackerRank: While known for coding assessments, HackerRank also publishes valuable reports on developer skills and hiring trends, which are undoubtedly powered by internal data collection and analysis similar to this pipeline.
- Indeed Hiring Lab: Indeed leverages its vast database of job postings and resumes to publish extensive reports and dashboards on labor market trends, including in-demand skills, salary insights, and hiring activity.
- LinkedIn Workforce Insights: LinkedIn, with its immense professional network and job postings, provides unparalleled insights into workforce trends, skill gaps, and hiring patterns, which are derived from continuous data processing pipelines.
This project, for a portfolio or product, aims to replicate the core intelligence engine of such platforms in a focused AI/ML context, demonstrating proficiency in data engineering, web scraping, and analytics.
🚀 Results:
- ✅ Extracts 100s of job listings daily from target job boards: The Scrapy/BeautifulSoup spider successfully navigates specified job portals, handling pagination and dynamic content, and extracts raw HTML or structured JSON data for hundreds or thousands of job postings on a daily or scheduled basis.
- ✅ Transforms job descriptions into structured fields (role, location, salary, skills): The Python processing layer cleanses the raw extracted text. This involves:
- Role Categorization: Using keyword matching or more advanced NLP to classify job titles into standardized roles (e.g., "ML Engineer," "Data Scientist," "AI Researcher").
- Location Parsing: Extracting and normalizing city, state, and country information.
- Salary Extraction & Normalization: Identifying numerical salary ranges within job descriptions, inferring currency, and converting to a consistent annual range (e.g., USD per year). This is often the most challenging part due to inconsistent formats.
- Skill Extraction: Identifying required and preferred technical skills (e.g., Python, PyTorch, SQL, AWS, Azure, GCP, Docker, Kubernetes, NLP, Computer Vision) and soft skills (e.g., communication, problem-solving).
- Company Name & Industry Identification.
- Duplicate Removal: Ensuring each unique job posting is represented only once.
- ✅ Loads cleaned records into PostgreSQL: The structured and transformed job data, now in a clean, tabular format, is efficiently loaded into the PostgreSQL database. Each record typically includes columns for job title, company, location, extracted skills (e.g., as an array or JSONB field), salary range (min/max), job description snippet, and a timestamp of extraction.
- ✅ Powers dashboards that show which cities hire the most AI engineers, which roles pay best, and which tools (like TensorFlow, HuggingFace) dominate: Google Data Studio or Streamlit dashboards dynamically query the PostgreSQL database to present key insights:
- Interactive maps showing AI job density by city/region.
- Bar charts comparing average salaries by job role, experience level, or city.
- Word clouds or bar charts highlighting the most frequently mentioned skills and tools (TensorFlow, PyTorch, HuggingFace, Scikit-learn, AWS, Azure, GCP, etc.).
- Trend lines showing the evolution of job postings over time.
- Company-specific hiring patterns.
- ✅ Enables automated weekly reports and alerts for new job spikes: Leveraging Apache Airflow, the pipeline can be extended to automatically generate summary reports (e.g., a PDF or email digest) on a weekly basis, highlighting key changes in the job market. Airflow can also be configured to send immediate alerts (e.g., via email or Slack) when a significant spike in job postings for a particular role or skill is detected, or when a high-paying job matching specific criteria is found.
Project 10: AI Job Trends Scraper + ETL System Codes:
🔗 View Project Code on GitHubThis solution is provided as a single Python script (app.py).
Here's what the code will do:
- Database Setup: Define a SQLAlchemy model for
JobPostingto store the structured job data and set up a SQLite database. - Simulated Data Extraction (
simulate_job_listings): Generate synthetic job listings, including job titles, company names, locations, posted dates, and descriptions that contain various AI/ML-related skills and simulated salary information. - Data Transformation (
transform_job_data):- Parse job titles into broader "role categories" (e.g., "ML Engineer", "Data Scientist").
- Extract and normalize salary ranges from descriptions.
- Identify and extract key AI/ML skills from job descriptions using keyword matching.
- Perform basic deduplication.
- Data Loading (
load_job_data_to_db): Load the cleaned and enriched job data into the SQLite database. - Analysis & Visualization (
analyze_and_visualize_trends): Query the unified data from the database to:- Count jobs by role category and location.
- Calculate average salaries by role.
- Identify the most frequently mentioned skills.
- Generate plots using
matplotlibandseabornto visualize these trends.
🧩 Conclusion: Build Data Pipelines That Actually Power the Future
In 2025, the data landscape has fundamentally shifted. Businesses no longer merely accumulate vast quantities of raw data; they demand actionable insights that move with the speed of business, decisions that scale effortlessly with growing demand, and data pipelines that exhibit unwavering resilience under real-world pressure. This isn't just about collecting information; it's about transforming it into a strategic asset.
The ten ETL projects outlined here are far from academic exercises or mere additions to a GitHub portfolio. They represent battle-tested workflows inspired by actual industry use cases across critical sectors like healthcare, fintech, retail, Industrial IoT, and Artificial Intelligence. These aren't theoretical constructs; they are the digital arteries powering modern enterprises.
Why these projects are critical for your success:
- Real-World Relevance: Each project addresses a tangible business problem, from optimizing supply chains to detecting health anomalies or tracking AI job market shifts. This demonstrates your ability to connect technical solutions to business value.
- Production-Grade Thinking: The technologies selected (e.g., Apache Airflow for orchestration, cloud-native databases like Snowflake/Redshift/DynamoDB, real-time brokers like Kafka/Mosquitto) are standard in production environments. Building with these tools proves you can design and implement robust, scalable, and maintainable systems.
- Beyond Basic ETL: These projects push beyond simple data movement. They involve complex transformations, anomaly detection, real-time processing, integration with APIs and diverse data sources, and the crucial step of turning raw data into interactive dashboards and alert systems.
- Showcasing Versatility: By working on these diverse projects, you showcase your adaptability across different domains and data types (structured, semi-structured, time-series, streaming), a highly sought-after trait in data engineering.
- Direct Impact on Business Metrics: The "Impact / ROI" section for each project highlights how your data pipeline directly contributes to measurable business outcomes—reducing costs, improving customer satisfaction, enabling early detection, or informing strategic decisions. This is the language of business leaders.
For Aspiring Data Engineers: These projects provide an unparalleled opportunity to bridge the gap between theoretical knowledge and practical application. They offer concrete examples to discuss in interviews, demonstrate problem-solving skills, and validate your proficiency with industry-standard tools.
For Experienced Professionals Scaling Your Portfolio: If you're looking to showcase your ability to tackle complex, high-impact data challenges or transition into new domains (like IoT or real-time analytics), these projects offer the depth and breadth needed to stand out.
For Businesses Building Internal Tooling: These project blueprints serve as a foundational guide for developing essential data infrastructure that drives operational efficiency, powers data-driven strategies, and provides a competitive edge.
In 2025 and beyond, data engineers are not just technicians; they are architects of insight, engineers of efficiency, and enablers of innovation. The demand for skilled data engineers who can build and maintain such pipelines is skyrocketing. Modern data engineering involves:
- Hybrid ETL/ELT Architectures: Often combining the best of both worlds – ETL for sensitive or real-time data, and ELT for large-scale cloud analytics.
- Real-Time and Streaming Capabilities: The shift from batch processing to real-time insights for immediate decision-making.
- Robust Data Quality and Governance: Implementing automated checks, anomaly detection, lineage tracking, and strong security measures.
- Advanced Orchestration and Observability: Using tools like Airflow for complex workflows and comprehensive monitoring to ensure pipeline health.
- Cloud-Native and Serverless Paradigms: Leveraging elastic, managed services to build scalable and cost-effective solutions.
- AI Integration: Incorporating machine learning for smarter data transformation, anomaly detection, and even automated pipeline optimization.
So, don't just extract, transform, and load. Extract outcomes. Build pipelines that directly reveal opportunities and solve pain points. Transform industries. Leverage data to revolutionize how businesses operate and serve their customers. And in doing so, you will undeniably Load your future with invaluable skills, impactful contributions, and a highly demanded career path.

🚀 About This Program — Industry-Ready Data Science Engineering
By 2030, data won’t just inform decisions — it will drive them automatically. From fraud detection in milliseconds to personalized healthcare and real-time market forecasting, data science is the engine room of every intelligent system.
🛠️ The problem? Most programs throw you some Python scripts and drown you in Kaggle. But the industry doesn’t want notebook jockeys — it wants data strategists, model builders, and pipeline warriors who can turn chaos into insight, and insight into action.
🔥 That’s where Huebits flips the script.
We don’t train you to understand data science.
We train you to engineer it.
Welcome to a 6-month, hands-on, industry-calibrated Data Science Program — designed to take you from zero to deployable, from beginner to business-impacting. Whether it’s building scalable ML models, engineering clean data pipelines, or deploying predictions with APIs — you’ll learn what it takes to own the full lifecycle.
From mastering Python, Pandas, Scikit-learn, TensorFlow, and PyTorch, to building real-time dashboards, deploying on AWS, GCP, or Azure, and integrating with APIs and databases — this program equips you for the real game.
🎖️ Certification:
Graduate with the Huebits Data Science Engineering Credential — a mark of battle-tested ability, recognized by startups, enterprises, and innovation labs. This isn’t a pat on the back — it’s proof you can model, optimize, and deploy under pressure.
📌 Why This Program Hits Different:
Real-world, end-to-end Data Science & ML projects
Data pipeline building, model tuning, and cloud deployment
LMS access for a full year
Job guarantee upon successful completion
💥 Your future team doesn’t care if you’ve memorized the Titanic dataset —
They care how fast you can clean dirty data, validate a model, ship it to production, and explain it to the CEO.
Let’s train you to do exactly that.
🎯 Join Huebits’ Industry-Ready Data Science Engineering Program
and build a career powered by precision, insight, and machine learning mastery.
Line by line. Model by model. Decision by decision.

🔥 "Take Your First Step into the Data Science Revolution!"
Ready to turn raw data into intelligent decisions, predictions, and impact? From fraud detection to recommendation engines, real-time analytics to AI-driven automation — data science is the brain behind today’s smartest systems.
Join the Huebits Industry-Ready Data Science Engineering Program and get hands-on with real-world datasets, model building, data pipelines, and full-stack deployment — using the same tech stack trusted by global data teams and AI-first companies.
✅ Live Mentorship | 🧠 Industry-Backed ML Projects | ⚙️ Deployment-Ready, Career-Focused Curriculum